This tutorial and the assets can be downloaded as part of the Wallaroo Tutorials repository.
Anomaly Detection
Wallaroo provides multiple methods of analytical analysis to verify that the data received and generated during an inference is accurate. This tutorial will demonstrate how to use anomaly detection to track the outputs from a sample model to verify that the model is outputting acceptable results.
Anomaly detection allows organizations to set validation parameters in a pipeline. A validation is added to a pipeline to test data based on an expression, and flag any inferences where the validation failed inference result and the pipeline logs.
This tutorial will follow this process in setting up a validation to a pipeline and examining the results:
- Create a workspace and upload the sample model.
- Establish a pipeline and add the model as a step.
- Add a validation to the pipeline.
- Perform inferences and display anomalies through the
InferenceResultobject and the pipeline log files.
This tutorial provides the following:
- Housing model:
./models/housingprice.onnx- a pretrained model used to determine standard home prices. - Test Data:
./data- sample data.
Prerequisites
- A deployed Wallaroo instance
- The following Python libraries installed:
Steps
Import libraries
The first step is to import the libraries needed for this notebook.
import wallaroo
from wallaroo.object import EntityNotFoundError
import os
import json

from IPython.display import display

# used to display dataframe information without truncating
from IPython.display import display
import pandas as pd
pd.set_option('display.max_colwidth', None)

import datetime
Connect to the Wallaroo Instance
The first step is to connect to Wallaroo through the Wallaroo client. The Python library is included in the Wallaroo install and available through the Jupyter Hub interface provided with your Wallaroo environment.
This is accomplished using the wallaroo.Client() command, which provides a URL to grant the SDK permission to your specific Wallaroo environment. When displayed, enter the URL into a browser and confirm permissions. Store the connection into a variable that can be referenced later.
If logging into the Wallaroo instance through the internal JupyterHub service, use wl = wallaroo.Client(). For more information on Wallaroo Client settings, see the Client Connection guide.
# Login through local Wallaroo instance

wl = wallaroo.Client()
Create Workspace
We will create a workspace to manage our pipeline and models. The following variables will set the name of our sample workspace then set it as the current workspace.
workspace_name = 'anomalytesting'
pipeline_name = 'anomalytestexample'
model_name = 'anomaly-housing-model'
model_file_name = './models/house_price_keras.onnx'
def get_workspace(name):
    workspace = None
    for ws in wl.list_workspaces():
        if ws.name() == name:
            workspace= ws
    if(workspace == None):
        workspace = wl.create_workspace(name)
    return workspace
workspace = get_workspace(workspace_name)

wl.set_current_workspace(workspace)
{'name': 'anomalytesting', 'id': 145, 'archived': False, 'created_by': '138bd7e6-4dc8-4dc1-a760-c9e721ef3c37', 'created_at': '2023-03-06T19:27:47.219395+00:00', 'models': [{'name': 'anomaly-housing-model', 'versions': 1, 'owner_id': '""', 'last_update_time': datetime.datetime(2023, 3, 13, 16, 39, 41, 683686, tzinfo=tzutc()), 'created_at': datetime.datetime(2023, 3, 13, 16, 39, 41, 683686, tzinfo=tzutc())}], 'pipelines': [{'name': 'anomalyhousing', 'create_time': datetime.datetime(2023, 3, 6, 19, 37, 23, 71334, tzinfo=tzutc()), 'definition': '[]'}]}
Upload The Model
The housing model will be uploaded for use in our pipeline.
housing_model = (wl.upload_model(model_name,
                                 model_file_name,
                                 framework=wallaroo.framework.Framework.ONNX)
                                 .configure(tensor_fields=["tensor"])
                )
Build the Pipeline and Validation
The pipeline anomaly-housing-pipeline will be created and the anomaly-housing-model added as a step. A validation will be created for outputs greater 100.0. This is interpreted as houses with a value greater than $350 thousand with the add_validation method. When houses greater than this value are detected, the InferenceObject will add it in the check_failures array with the message “price too high”.
Once complete, the pipeline will be deployed and ready for inferences.
p = wl.build_pipeline(pipeline_name)
p = p.add_model_step(housing_model)
p = p.add_validation('price too high', housing_model.outputs[0][0] < 35.0)
pipeline = p.deploy()
Testing
Two data points will be fed used for an inference.
The first, labeled response_normal, will not trigger an anomaly detection. The other, labeled response_trigger, will trigger the anomaly detection, which will be shown in the InferenceResult check_failures array.
Note that multiple validations can be created to allow for multiple anomalies detected.
if arrowEnabled is True:
    normal_input = pd.DataFrame.from_records({"tensor": [
                                                [
                                                    0.6752651953165153,
                                                    0.49993424710692347,
                                                    0.7386510547400537,
                                                    1.4527294113261855,
                                                    -0.08666382440547035,
                                                    -0.0713079330077084,
                                                    1.8870291307801872,
                                                    0.9294639723887077,
                                                    -0.305653139057544,
                                                    -0.6285378875598833,
                                                    0.29288456205300767,
                                                    1.181109967163617,
                                                    -0.65605032361317,
                                                    1.1203567680905366,
                                                    -0.20817781526102327,
                                                    0.9695503533113344,
                                                    2.823342771358126
                                                ]
                                            ]
                                        })
else:
    normal_input = {"tensor": [
                                                [
                                                    0.6752651953165153,
                                                    0.49993424710692347,
                                                    0.7386510547400537,
                                                    1.4527294113261855,
                                                    -0.08666382440547035,
                                                    -0.0713079330077084,
                                                    1.8870291307801872,
                                                    0.9294639723887077,
                                                    -0.305653139057544,
                                                    -0.6285378875598833,
                                                    0.29288456205300767,
                                                    1.181109967163617,
                                                    -0.65605032361317,
                                                    1.1203567680905366,
                                                    -0.20817781526102327,
                                                    0.9695503533113344,
                                                    2.823342771358126
                                                ]
                                            ]
                                        }
result = pipeline.infer(normal_input)
display(result)
| time | in.tensor | out.dense_2 | check_failures | |
|---|---|---|---|---|
| 0 | 2023-03-13 20:18:34.677 | [0.6752651953, 0.4999342471, 0.7386510547, 1.4527294113, -0.0866638244, -0.071307933, 1.8870291308, 0.9294639724, -0.3056531391, -0.6285378876, 0.2928845621, 1.1811099672, -0.6560503236, 1.1203567681, -0.2081778153, 0.9695503533, 2.8233427714] | [13.12781] | 0 |
if arrowEnabled is True:
    trigger_input= pd.DataFrame.from_records({"tensor": [
                                                        [0.6752651953165153, -1.4463372267359147, 0.8592227450151407, -1.336883943861539, -0.08666382440547035, 372.11547809844996, -0.26674056237955046, 0.005746226275241667, 2.308796820400806, -0.6285378875598833, -0.5584151415472702, -0.08354305857288258, -0.65605032361317, -1.4648287573778653, -0.20817781526102327, 0.22552571571180896, -0.30338131340656516]
                                                    ]
                                                }
                                            )
else:
    trigger_input= {"tensor": [
                            [0.6752651953165153, -1.4463372267359147, 0.8592227450151407, -1.336883943861539, -0.08666382440547035, 372.11547809844996, -0.26674056237955046, 0.005746226275241667, 2.308796820400806, -0.6285378875598833, -0.5584151415472702, -0.08354305857288258, -0.65605032361317, -1.4648287573778653, -0.20817781526102327, 0.22552571571180896, -0.30338131340656516]
                        ]
                    }
trigger_result = pipeline.infer(trigger_input)
display(trigger_result)
| time | in.tensor | out.dense_2 | check_failures | |
|---|---|---|---|---|
| 0 | 2023-03-13 18:53:50.585 | [0.6752651953, -1.4463372267, 0.859222745, -1.3368839439, -0.0866638244, 372.1154780984, -0.2667405624, 0.0057462263, 2.3087968204, -0.6285378876, -0.5584151415, -0.0835430586, -0.6560503236, -1.4648287574, -0.2081778153, 0.2255257157, -0.3033813134] | [39.575085] | 1 |
Multiple Tests
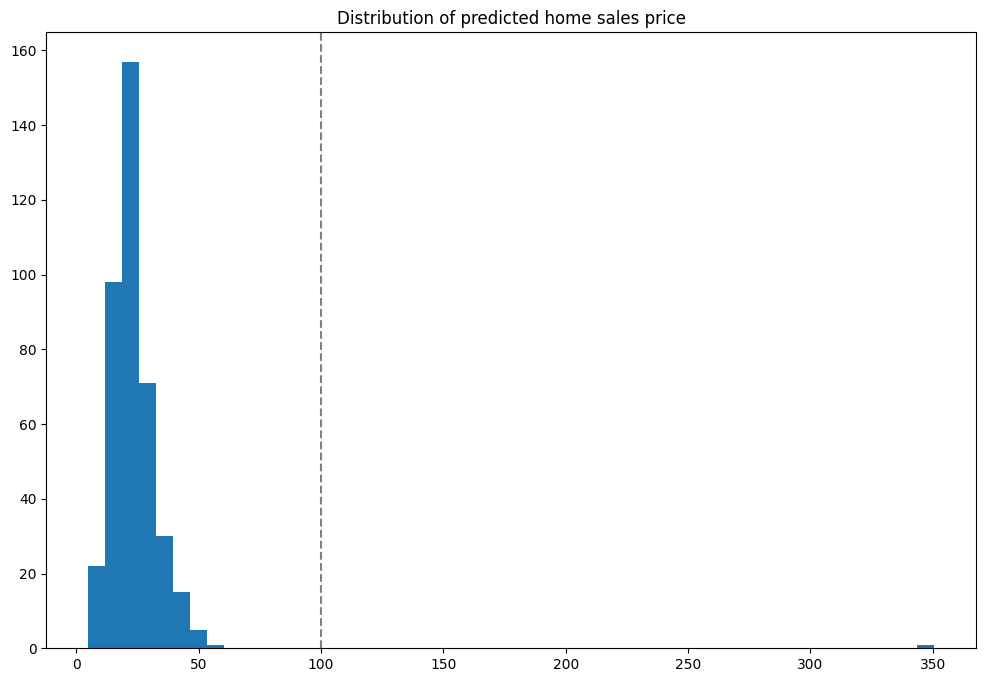
With the initial tests run, we can run the inferences against a larger set of data and identify anomalies that appear versus the expected results. These will be displayed into a graph so we can see where the anomalies occur. In this case with the house that came in at $350 million - outside of our validation range.
Note: Because this is splitting one batch inference into 500 separate inferences for this example, it may take longer to run.
Notice the one result that is outside the normal range - the one lonely result on the far right.
if arrowEnabled is True:
    test_data = pd.read_json("./data/houseprice_inputs_500.json", orient="records")
    responses_anomaly = pd.DataFrame()
    # For the first 1000 rows, submit that row as a separate DataFrame
    # Add the results to the responses_anomaly dataframe
    for index, row in test_data.head(500).iterrows():
        responses_anomaly = responses_anomaly.append(pipeline.infer(row.to_frame('tensor').reset_index()))
else:
    test_data = json.load("./data/houseprice_inputs_500.json")
    responses_anomaly =[]
    for nth in range(500):
        responses_anomaly.extend(pipeline.infer({ "tensor": [test_data['tensor'][0][nth]]}))
import pandas as pd
import matplotlib.pyplot as plt
%matplotlib inline
if arrowEnabled is True:
    houseprices = pd.DataFrame({'sell_price': responses_anomaly['out.dense_2'].apply(lambda x: x[0])})
else:
    houseprices = pd.DataFrame({'sell_price': [r.raw['outputs'][0]['Float']['data'][0] for  r in responses_anomaly]})

houseprices.hist(column='sell_price', bins=75, grid=False, figsize=(12,8))
plt.axvline(x=40, color='gray', ls='--')
_ = plt.title('Distribution of predicted home sales price')
How To Check For Anomalies
There are two primary methods for detecting anomalies with Wallaroo:
- As demonstrated in the example above, from the
InferenceObjectcheck_failuresarray in the output of each inference to see if anything has happened. - The other method is to view pipeline’s logs and see what anomalies have been detected.
View Logs
Anomalies can be displayed through the pipeline logs() method.
For Arrow enabled Wallaroo instances, the logs are returned as a dataframe. Filtering by the column check_failures greater than 0 displays any inferences that had an anomaly triggered.
For Arrow disabled Wallaroo instances, the parameter valid=False will show any validations that were flagged as False - in this case, houses that were above 350 thousand in value.
if arrowEnabled is True:
    logs = pipeline.logs()
    logs = logs.loc[logs['check_failures'] > 0]
else:
    logs = pipeline.logs(valid=False)
display(logs)
Warning: Pipeline log size limit exceeded. Please request logs using export_logs
| time | in.index | in.tensor | out.dense_2 | check_failures | |
|---|---|---|---|---|---|
| 32 | 2023-03-13 19:41:03.596 | tensor | [0.6752651953, -1.4463372267, 0.859222745, -1.3368839439, -0.0866638244, 372.1154780984, -0.2667405624, 0.0057462263, 2.3087968204, -0.6285378876, -0.5584151415, -0.0835430586, -0.6560503236, -1.4648287574, -0.2081778153, 0.2255257157, -0.3033813134] | [39.575085] | 1 |
Undeploy The Pipeline
With the example complete, we undeploy the pipeline to return the resources back to the Wallaroo instance.
pipeline.undeploy()
| name | anomalytestexample |
|---|---|
| created | 2023-03-13 20:18:16.622828+00:00 |
| last_updated | 2023-03-13 20:18:18.995804+00:00 |
| deployed | False |
| tags | |
| versions | dec18ab4-8b71-44c9-a507-c9763803153f, 64246a8b-61a8-4ead-94aa-00f4cf571f74 |
| steps | anomaly-housing-model |