Metrics Admin
Table of Contents
Wallaroo Enterprise Pipeline Management
Organizations can manage pipelines through the Wallaroo Dashboard via the Platform Admin Dashboard. This dashboard is the default login for users assigned the type admin.
How to Access the Platform Admin Dashboard
To access the Platform Admin Dashboard:
- Login to the Wallaroo Dashboard as a user of type
admin.
If a user is not assigned the admin type, the option Platform Admin Dashboard is not available. If they attempt to reference the Platform Admin Dashboard without being of type admin, the following error message is displayed:
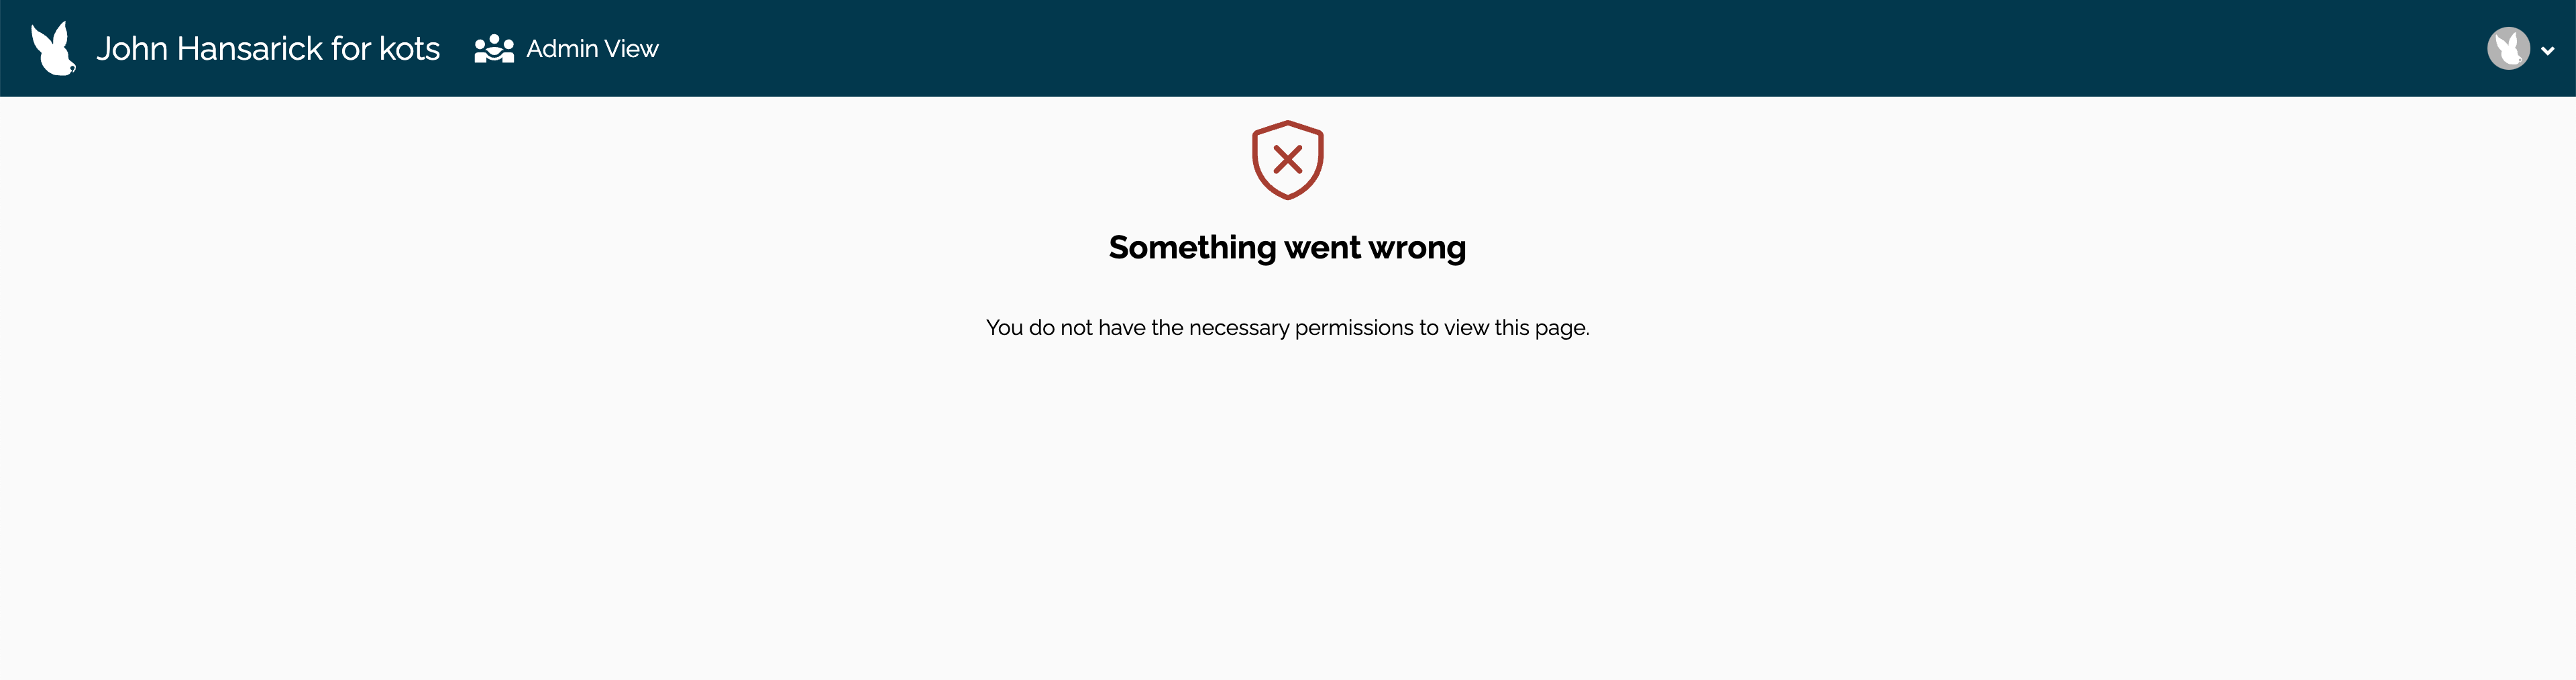
Something went wrong
You do not have the necessary permissions to view this page.
Users can return to the Platform Admin Dashboard to manage their workspace via the following process:
- From the Platform Admin Dashboard: From the upper right corner, select the Wallaroo icon drop down, and select Platform Admin Dashboard.
- Select which Wallaroo element to manage:
- Users
- Pipelines
- Models
- Workloads
- Metrics
Metrics View
The Metrics View contains two main sections:
- Infrastructure Consumption: This shows the overall consumption of resources (CPUS, memory, GPUs) for the entire Wallaroo instance, some at the point in time when the tab is viewed and others that average over the selected time range.
- Infrastructure Usage Breakdown by Pipelines Over Time: This shows the consumption of resources (CPUs, memory, GPUs) for each pipeline over the selected time range.
These metrics page is updated upon page refresh or when the filters are updated, and do not reflect dynamic conditions, but only the current settings and filters applied. Note that requesting large amounts of data may take a additional time be too large to calculate.
Infrastructure Consumption
The Infrastructure Consumption section shows the overall consumption of resources requested for model, orchestrations, and other artifacts. This section is not updated unless the page is refreshed or the filter values updated.
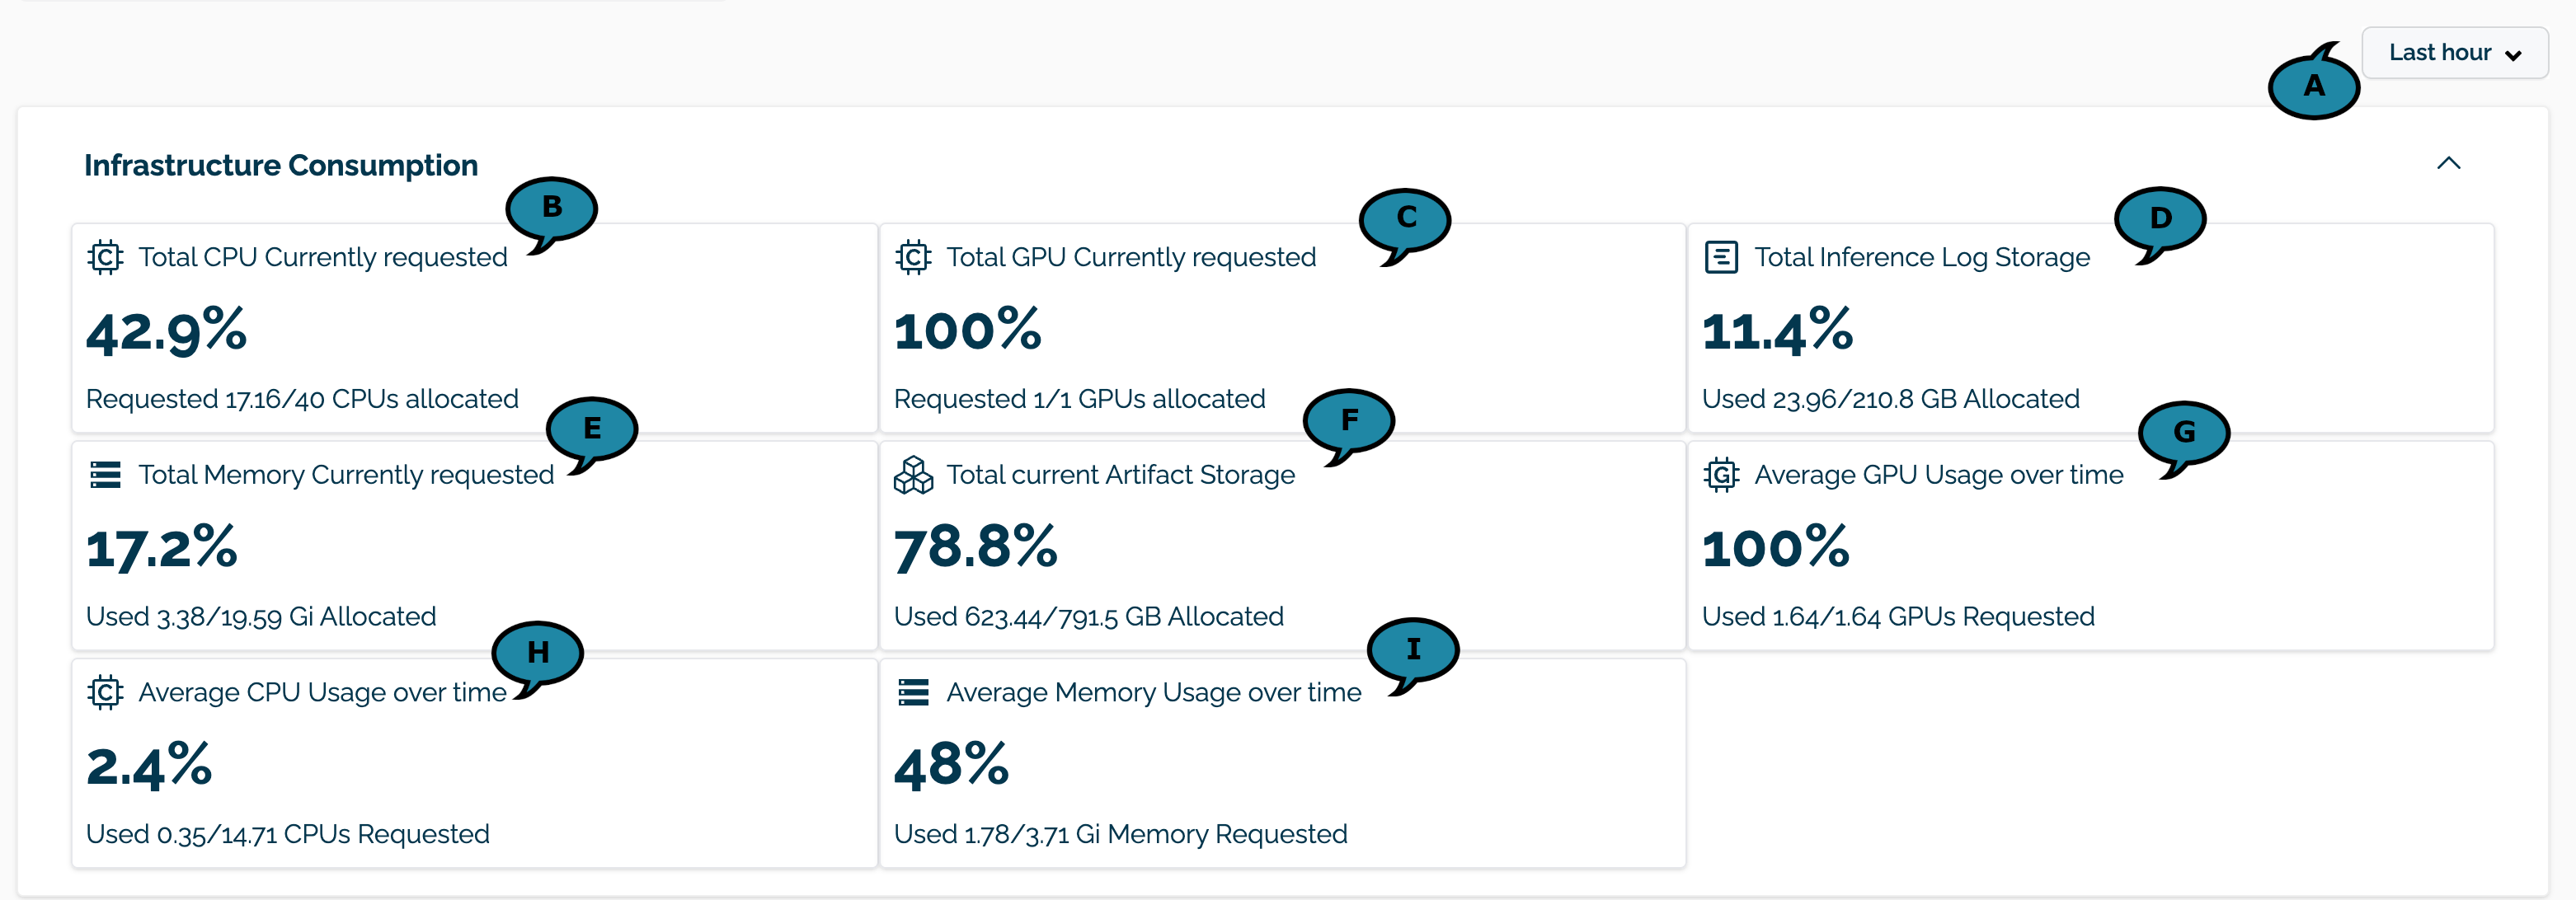
The following filters and metrics are available:
- Time Selector (A): Sets the period of time over which the summary Average cards and the pipeline metrics are aggregate, by default 1 day, minimum of 1 hour.
- Total CPU Currently requested. (B): The total number of CPUs utilized compared to the CPUs currently allocated. This number uses the fractional number of CPUs, for example: Requested 4.73/32 CPUs allocated.
- Total GPU Currently requested. (C): The total of GPUs utilized compared to the GPUs currently allocated. This number uses the whole number of GPUs. For example: Requested 2/5 GPUs allocated
- Total Inference Log Storage. (D): The amount of storage capacity used for log data compared to the total storage capacity. For example: Used 49.17/105.1 GB Allocated.
- Total Memory Currently requested. (E): The amount of memory currently in use compared to the total memory requested. For example: Used 14.44/15.67 Gi Allocated.
- Total current Artifact Storage. (F): The amount of storage space used for model and orchestration artifacts compared to total storage space allocated. For example: Used 13.15/685.8 GB Allocated.
- Average GPU Usage over time. (G): The average GPU usage compared to requested GPU usage over the selected time range in whole integer values. For example: Used 3/5 GPUs Requested.
- AVG CPU Currently requested. (H): The average CPU usage compared to requested CPU usage over the selected time range as fractional values. For example: Used 4.68/32 CPUs Requested.
- AVG Memory Currently requested. (I): The average memory usage compared to requested memory usage over the selected time range. For example: Used 15.13/15.67 Gi Memory Requested.
Infrastructure Usage Breakdown by Pipelines Over Time
The Infrastructure Usage Breakdown by Pipelines Over Time section shows currently deployed pipelines and the resource allocation for each pipeline against requested resources for the selected time range. This section is not updated unless the page is refreshed or the filter values updated.
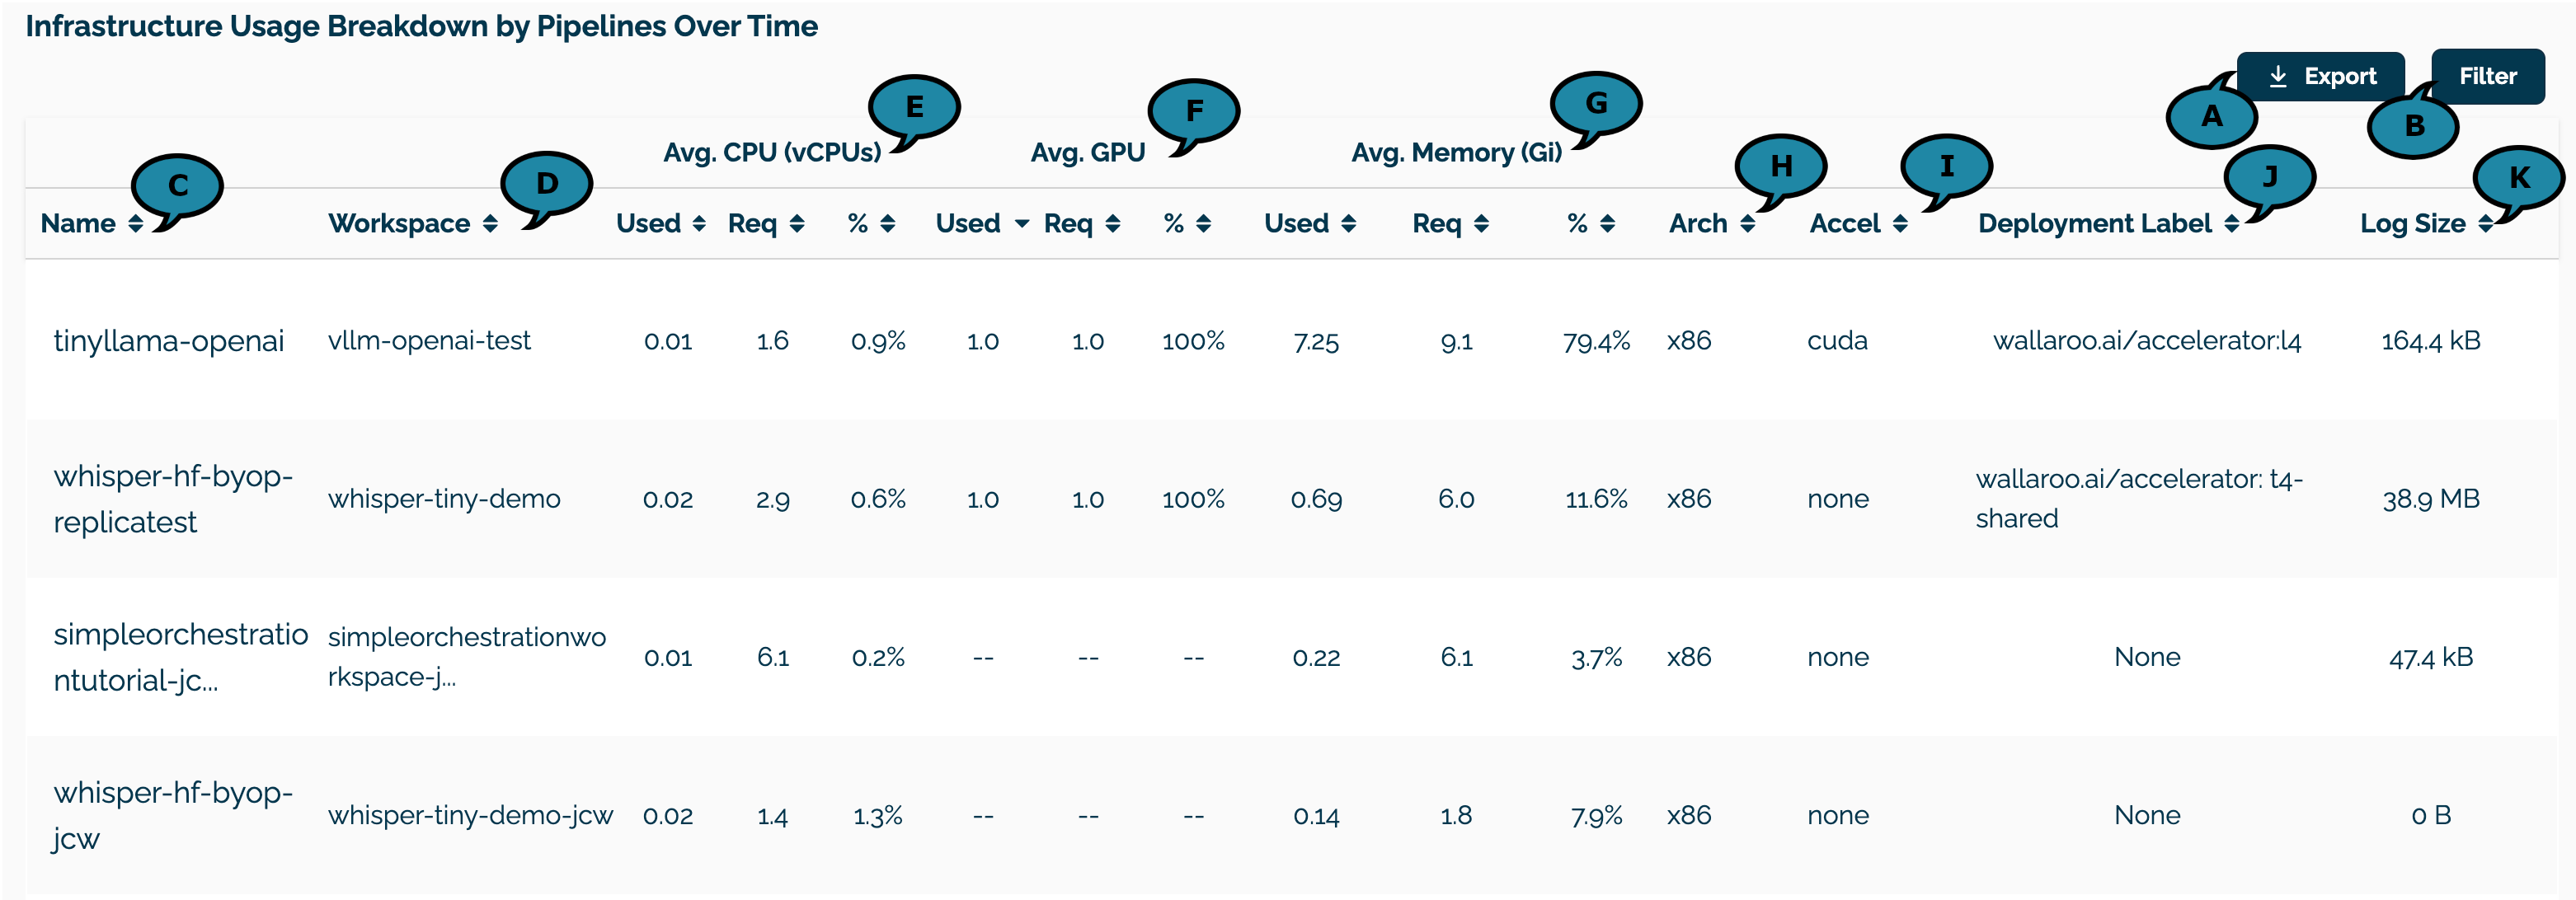
The following options are available:
- Export (A): Exports the current filtered pipeline values over the selected time range as a CSV file with the fields below.
- Filter (B): Filters the pipeline data shown by Workspace.
The following fields are displayed:
- Name (C): The name of the pipeline.
- Workspace (D): The workspace the pipeline is assigned to.
- Avg. CPU (vCPUs) (E): The average CPU usage over the selected time range with the following values:
- Used: The average used CPU usage over the selected time range.
- Req: The average requested CPUs over the selected time range.
- %: The percentage value of used compared to requested CPU usage over the selected time range.
- Avg. GPU (F): The average GPU usage over the selected time range with the following values:
- Used: The average used GPU usage over the selected time range.
- Req: The average requested GPUS over the selected time range.
- %: The percentage value of the GPU used compared to requested.
- Avg. Memory (Gi) (G): The average memory usage over the selected time range with the following values:
- Used: The average used memory usage over the selected time range.
- Req: The average requested memory over the selected time range.
- %: The percentage value of the memory used compared to requested.
- Arch (H): The hardware architecture set for the pipeline.
- Accel (I): The AI accelerator type assigned to the pipeline, if assigned.
- Deployment Label (J): The deployment label for the nodepools the pipelines run in, if assinged. Required for pipelines with GPU deployments.
- Log Size (K): Size of the inference logs associated with the pipeline.
Wallaroo Admin Dashboard Metrics Retrieval via the Wallaroo MLOps API
The following queries are available for resource consumption and available through the Admin Dashboard. Note where each request either uses the query endpoint or the query_range endpoint. For examples of these queries, see the Wallaroo Repository.
Supported Queries
Note that each of these queries use the /v1/metrics/api/v1/query endpoint.
| Query Name | Description | Example Query |
|---|---|---|
| Total CPU Requested | Number of CPUs requested in the Wallaroo cluster | sum(wallaroo_kube_pod_resource_requests{resource="cpu"}) |
| Total CPU allocated | Total number of available CPUs in the Wallaroo cluster | sum(kube_node_status_capacity{resource="cpu"}) |
| Total GPU Requested | Number of GPUs requested in the Wallaroo cluster | sum(wallaroo_kube_pod_resource_requests{resource=~"nvidia.com/gpu|qualcomm.com/qaic"}) |
| Total GPU Allocated | Total number of available GPUs in the Wallaroo cluster | sum(kube_node_status_capacity{resource=~"nvidia_com_gpu|qualcomm_com_qaic"}) |
| Total Memory Requested | Amount of memory requested in the Wallaroo cluster. | sum(wallaroo_kube_pod_resource_requests{resource="memory"}) |
| Total Memory Allocated | Total amount of memory available in the Wallaroo cluster. | sum(kube_node_status_capacity{resource="memory"}) |
| Total Inference Log Storage used | Amount of inference log storage used. | kubelet_volume_stats_used_bytes{persistentvolumeclaim="plateau-managed-disk"} |
| Total Inference Log Storage allocated | Total amount of inference log storage available. | kubelet_volume_stats_capacity_bytes{persistentvolumeclaim="plateau-managed-disk"} |
| Total Artifact Storage used | Amount of model and orchestration artifact storage used. | kubelet_volume_stats_capacity_bytes{persistentvolumeclaim="minio"} |
| Total Artifact Storage allocated | Total amount of model and orchestration artifact storage available. | kubelet_volume_stats_used_bytes{persistentvolumeclaim="minio"} |
| Average GPU usage over time | Average GPU usage over the defined time range in the Wallaroo cluster. | avg_over_time(sum(wallaroo_kube_pod_resource_requests{resource=~"nvidia.com/gpu|qualcomm.com/qaic"})[{duration}] {offset}) |
| Average GPU requested over time | Average number of GPU requested over the defined time range in the Wallaroo cluster | avg_over_time(sum(wallaroo_kube_pod_resource_requests{resource=~"nvidia.com/gpu|qualcomm.com/qaic"})[{duration}] {offset}) |
| Average CPU usage over time | Average CPU usage over the defined time range in the Wallaroo cluster. | avg_over_time(sum(wallaroo_kube_pod_resource_usage{resource=”cpu”})[{duration}] {offset}) |
| Average CPU requested over time | Average CPU requests over the defined time range in the Wallaroo cluster | avg_over_time(sum(wallaroo_kube_pod_resource_requests{resource="cpu"})[{duration}] {offset}) |
| Average Memory usage over time | Average memory usage over the defined time range in the Wallaroo cluster. | avg_over_time(sum(wallaroo_kube_pod_resource_usage{resource="memory"})[{duration}] {offset}) |
| Average Memory requests over time | Average memory requests over the defined time range in the Wallaroo cluster. | avg_over_time(sum(wallaroo_kube_pod_resource_requests{resource="memory"})[{duration}] {offset}) |
| Average pipelines CPU usage over time | Average CPU usage over the defined time range for an individual Wallaroo pipeline. | avg_over_time(sum by(namespace)(wallaroo_kube_pod_resource_usage{resource="cpu"})[{duration}] {offset}) |
| Average pipelines CPU requested over time | Average number of CPUs requested over the defined time range for an individual Wallaroo pipeline. | avg_over_time(sum by(namespace)(wallaroo_kube_pod_resource_requests{resource="cpu"})[{duration}] {offset}) |
| Average pipelines GPU usage over time | Average GPU usage over the defined time range for an individual Wallaroo pipeline. | avg_over_time(sum by(namespace)(wallaroo_kube_pod_resource_requests{resource=~"nvidia.com/gpu|qualcomm.com/qaic"})[{duration}] {offset}) |
| Average pipelines GPU requested over time | Average number of GPUs requested over the defined time range for an individual Wallaroo pipeline. | avg_over_time(sum by(namespace)(wallaroo_kube_pod_resource_requests{resource=~"nvidia.com/gpu|qualcomm.com/qaic"})[{duration}] {offset}) |
| Average pipelines Mem usage over time | Average memory usage over the defined time range for an individual Wallaroo pipeline. | avg_over_time(sum by(namespace) (wallaroo_kube_pod_resource_usage{resource="memory"})[{duration}] {offset}) |
| Average pipelines Mem requested over time | Average amount of memory requested over the defined time range for an individual Wallaroo pipeline. | avg_over_time(sum by (namespace)(wallaroo_kube_pod_resource_requests{resource="memory"})[{duration}] {offset}) |
| Pipeline inference log storage | Inference log storage used at the end of the defined time range for an individual Wallaroo pipeline | sum by(topic) (topic_bytes@{timestamp}) |