Troubleshooting Guides
Table of Contents
Troubleshooting
I’m Getting a Timeout Error
Depending on the connection and resources, the installation process may time out. If that occurs, use the --wait-duration flag to provide additional time. The time must be provided in Go duration format (for example: 60s, 1m, etc). The following example extends the wait duration to 10 minutes:
kubectl kots install wallaroo/ea -n wallaroo --license-file myfile.yaml --shared-password wallaroo --wait-duration 600s
Preflight Checks are Failing at the Command Line
If your system does not meet all of the preflight requirements, the installation process may fail when performing an automated installation. It is highly recommended to install Wallaroo on a system that meets all requirements or else performance will be degraded.
Before continuing, use the following command and note down any and all pre-flight checks that are listed as a failure. The license will be installed in later steps through the browser.
install wallaroo/ea -n wallaroo
To ignore preflight checks, use the --skip-preflights flag, as in the following example (Note: This is not recommended, only provided as an example.):
kubectl kots install wallaroo/ea -n wallaroo --license-file myfile.yaml --shared-password wallaroo --skip-preflights
When Launching JupyterHub, I get a Server 500 error
If you shut down and restart a Wallaroo instance in a new environment or change the IP address, some settings may not be updated. Run the following command to restart the deployment process and update the settings to match the current environment. Note that the namespace wallaroo is used - modify this to match the environment where Wallaroo is installed.
kubectl rollout restart deployment hub -n wallaroo
The resource wallaroo/daemonset/spire-agent shows as not loading - how do I fix it?
If the resource wallaroo/daemonset/spire-agent does not load, verify the kots version is 1.124.4. To upgrade the kots version in your Kubernetes cluster, see see Updating KOTS.
Usually this can be done by:
Updating the version of
kotswith the command:curl https://kots.io/install/1.124.4 | REPL_USE_SUDO=y bashUpgrade
kotsin the Kubernetes cluster with the following, replacing the namespacewallaroowith the namespace you have installed the Wallaroo Ops instance in:kubectl kots admin-console upgrade --namespace wallaroo
How do I Send Logs and Configurations to Wallaroo?
See the Wallaroo Support Bundle Generation Guide for instructions on how to create a support bundle used to troubleshoot installation and configuration issues.
How do I Fix a Stuck Upgrade?
When doing an upgrade of Wallaroo and access the Wallaroo instance via a browser, the following message indicates a “stuck” upgrade when it remains after the upgrade process is complete:
- Wallaroo upgrade in progress
Use the following procedures to clear the upgrade stream based on how Wallaroo was installed.
Cluster Install
For a cluster based install of Wallaroo, enter the following command, replacing $NAMESPACE with the namespace associated with the Wallaroo install:
kubectl run -i --rm --tty nats-box --restart=Never -n $NAMESPACE --image=natsio/nats-box
For example, for the namespace wallaroo this command is:
kubectl run -i --rm --tty nats-box --restart=Never -n wallaroo --image=natsio/nats-box
In a separate terminal shell, enter the following command:
nats -s nats stream purge wallaroo_upgrade_status
Air-Gapped Install
For air-gapped installations of Wallaroo, determine the private image registry with the following command. This returns the running pod that is the issue.
kubectl describe deployment dashboard|grep Image
The following is an example of the response from this command:
Image: abcdefg.dkr.ecr.us-east-2.amazonaws.com/wallaroo/dashboard:v2026.1.0-main-6081
For this example, the registry here is abcdefg.dkr.ecr.us-east-2.amazonaws.com/wallaroo/.
Enter the following command, replacing the image value with the pod returned in the previous command:
kubectl run -i --rm --tty nats-box --restart=Never -n wallaroo --image=abcdefg.dkr.ecr.us-east-2.amazonaws.com/wallaroo/nats-box:0.17.0-nonroot
Failed Deploy Status When Attempting to Upgrade
If a “Failed Deploy" message is shown in kots or helm, retrieve the pods to check for a stalled pre-upgrade hook. Replace the $NAMESPACE variable with the namespace used to install Wallaroo.
kubectl get pods -n $NAMESPACE
For example, for the namespace wallaroo the command is:
kubectl get pod -n wallaroo
If the pre-upgrade hook still shows Running under STATUS the following command will remove the pod so the upgrade can be attempted again. Replace the $NAMESPACE variable with the namespace used to install Wallaroo.
kubectl delete job wallaroo-pre-upgrade-hook -n $NAMESPACE
For example, for the namespace wallaroo the command is:
kubectl delete job wallaroo-pre-upgrade-hook -n wallaroo
How to Resolve the Message “failed to render archive directory” for Single Node Linux Installations
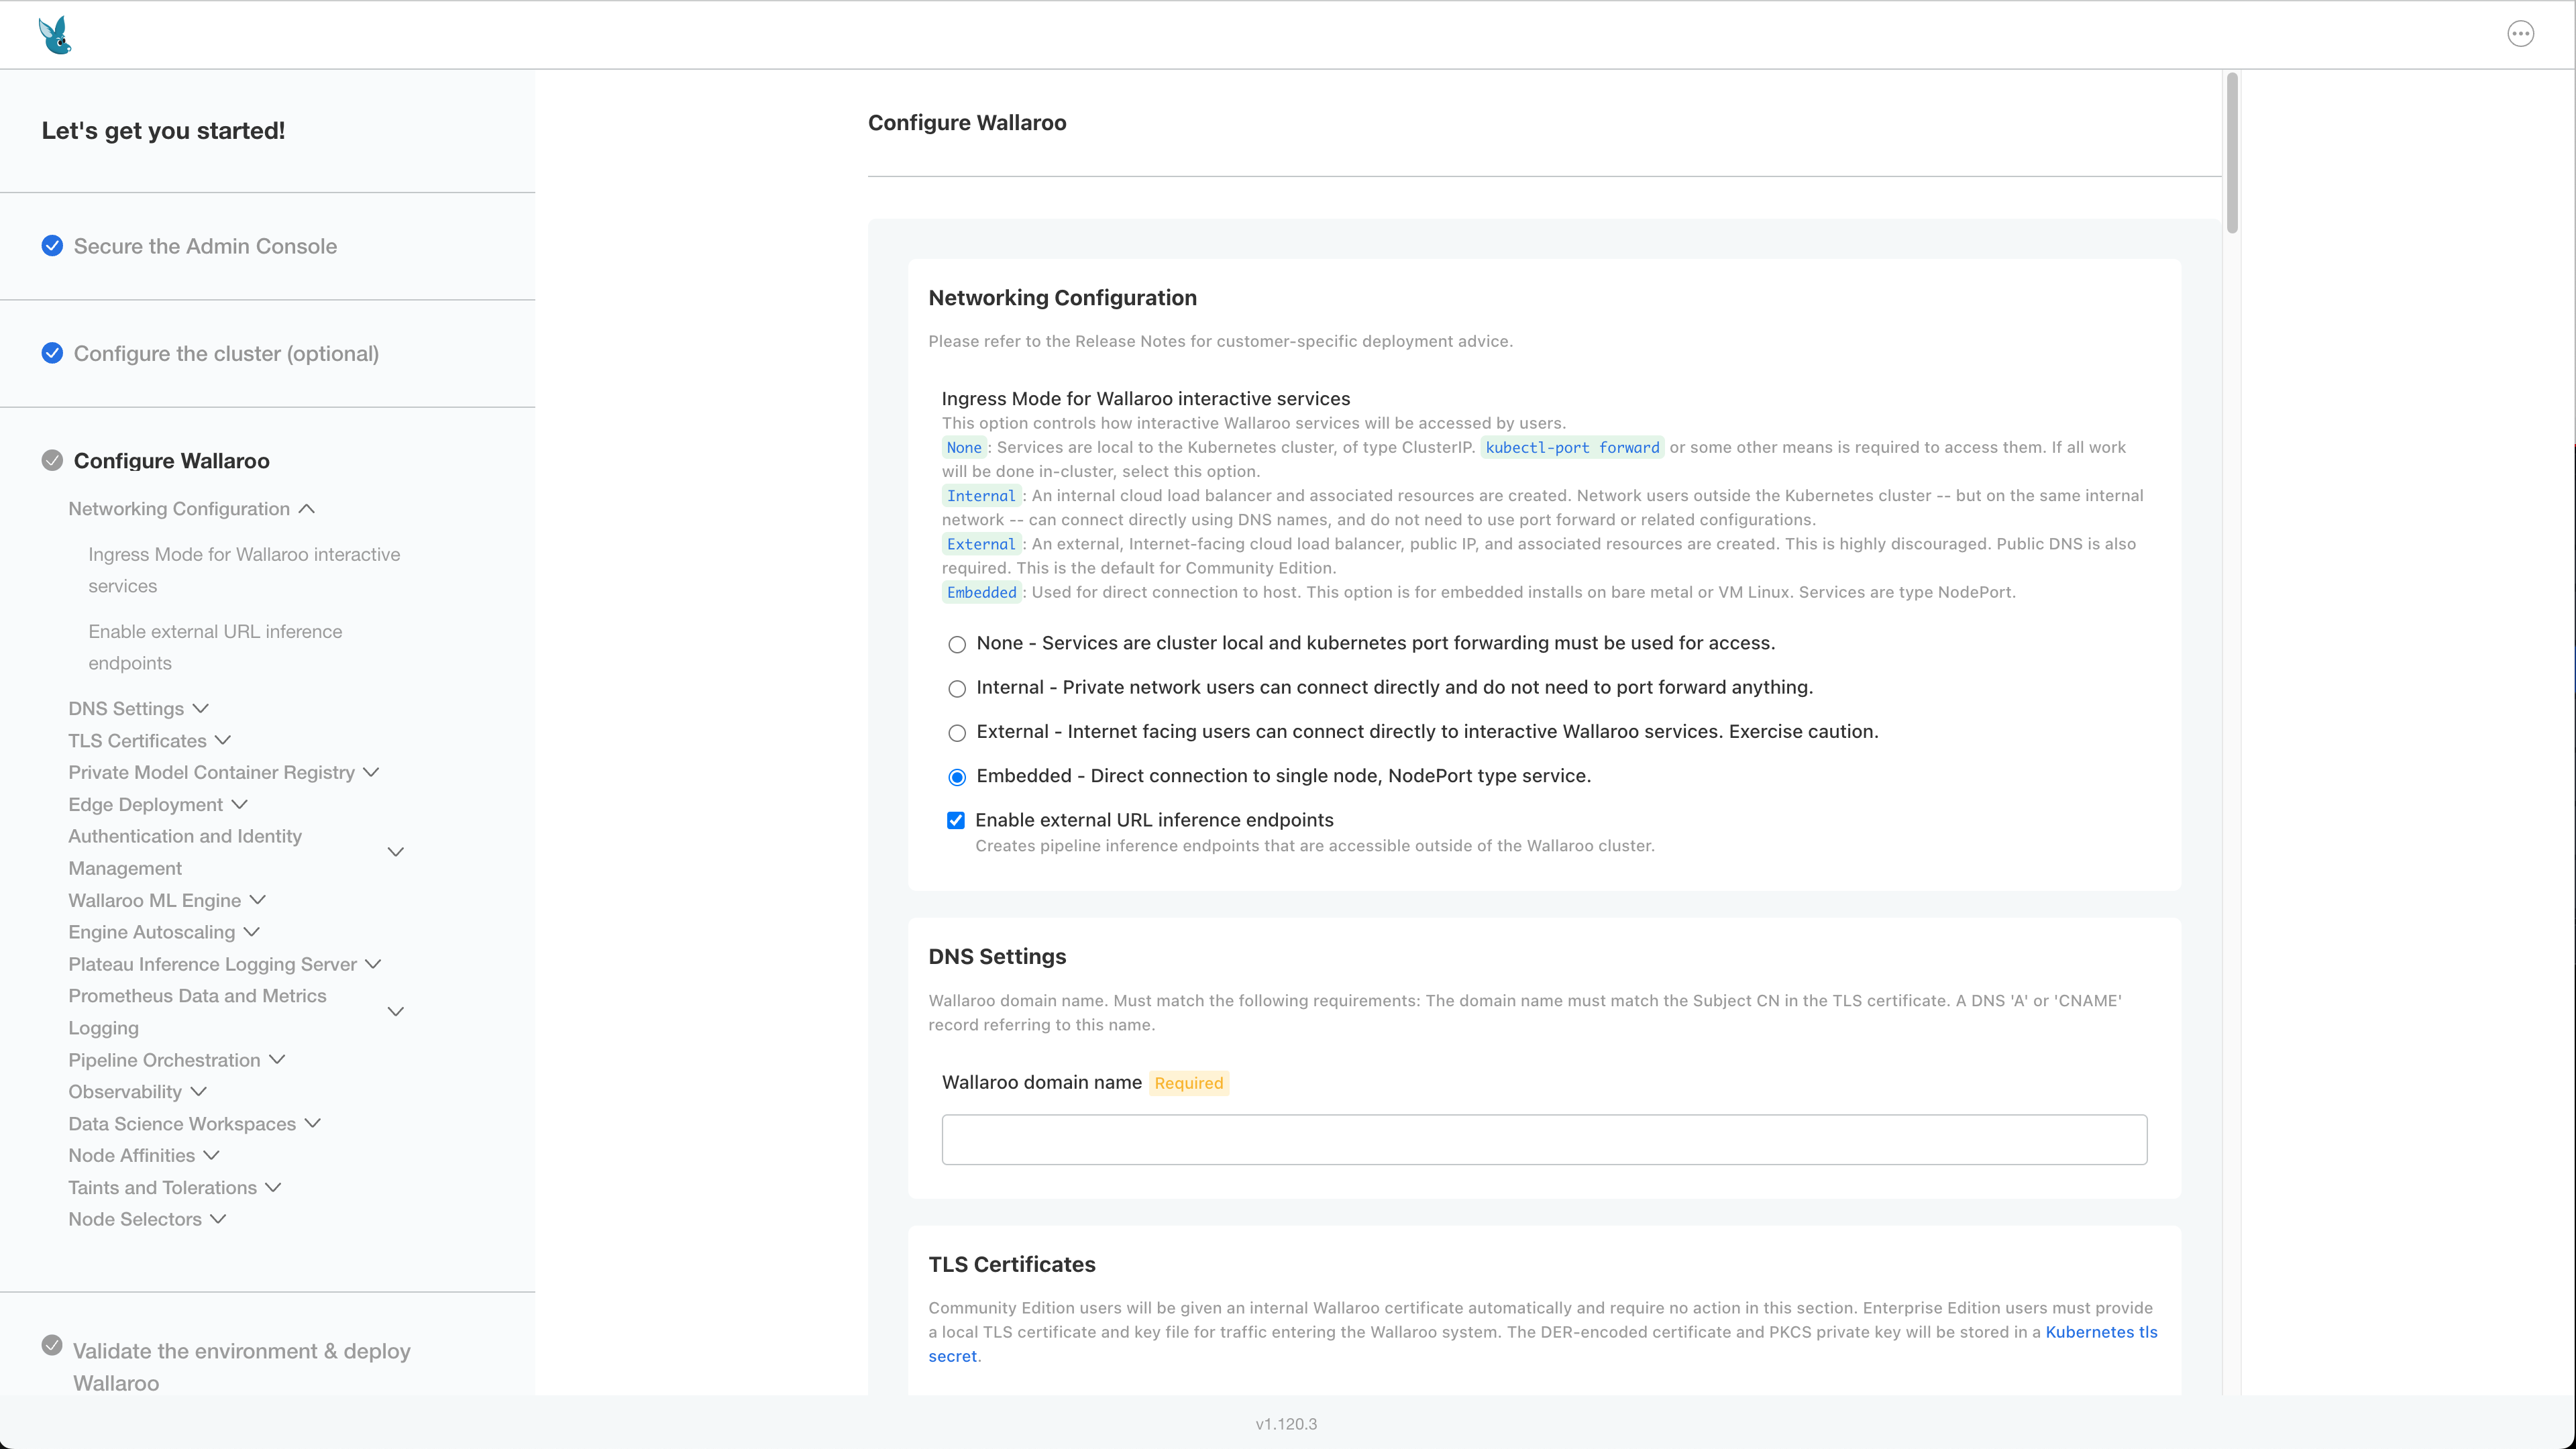
If the error failed to render archive directory appears during an installation of Single Node Installation or Air-Gapped Single Node installation, this may indicate the incorrect ingress mode was selected during the installation process.
Verify that Ingress mode is Embedded:
Wallaroo Stops Responding
A potential issue causing Wallaroo to stop responding is when the Postgres database no longer has storage capacity for additional logs and data. The following procedure confirms this as an issue and offers a resolution. Note that these commands require administrative access to the cluster hosting the Wallaroo installation and the kubectl command line tools.
Confirm the Disk is Full
To confirm the disk is full, run the following command. Adjust the namespace for the namespace used to install Wallaroo.
NAMESPACE=wallaroo
PG_POD=$(kubectl get pod -n $NAMESPACE -l role=postgres -o name | head -1)
kubectl exec -n $NAMESPACE $PG_POD -- df -h /var/lib/postgresql/data
The following shows a typical, healthy output for postgresql/data.
Filesystem                Size      Used Available Use% Mounted on
/dev/sdc                 97.9G     81.0M     97.8G   0% /var/lib/postgresql/data
If the Use% is near or equals 100%, this indicates an issue with storage space availability. The following shows this condition.
Filesystem                Size      Used Available Use% Mounted on
/dev/sdc                 97.9G     97.8G     97.8G   99% /var/lib/postgresql/data
If this condition occurs, continue following the guide. If storage is 80% or lower, contact your Wallaroo support representative for more assistance.
Delete the Emergency Buffer
If the postgresql/data output is near or at 100%, delete the buffer to free reserved space. Typically this is around 5Gi of storage capacity recovered.
kubectl exec -n $NAMESPACE $PG_POD -- \
  rm /var/lib/postgresql/data/emergency_buffer.bin
# Confirm space is recovered
kubectl exec -n $NAMESPACE $PG_POD -- df -h /var/lib/postgresql/data
Trigger the Cleaner Immediately
The next step is to trigger the Cleaner job as a cronjob command. The cleaner command:
- Delete rows older than
dbcleaner.maxAgeDays - Delete oldest rows from any table exceeding its disk quota safety threshold, down to the target watermark.
- Run
VACUUM FULLon any table that had rows deleted, physically returning space to the OS.
The executes this command now rather than waiting for the regularly scheduled run.
kubectl create job -n $NAMESPACE dbcleaner-manual-$(date +%s) \
  --from=cronjob/dbcleaner-job
To view the progress, the logs are followed via the kubernetes logs command with the -f flag to “follow” the logs:
kubectl logs -n $NAMESPACE -l app.kubernetes.io/name=dbcleaner-job -f
Verify Cleanup Was Successful
Once the process is complete, verify the disk space was updated via the following command:
kubectl exec -n $NAMESPACE $PG_POD -- df -h /var/lib/postgresql/data
For example, the following output is created:
Filesystem                Size      Used Available Use% Mounted on
/dev/sdc                 97.9G     81.0M     97.8G   0% /var/lib/postgresql/data
Confirm VACUUM completed cleanly (dead rows should be zero or near zero) via the following command:
kubectl exec -n $NAMESPACE $PG_POD -- \
  psql -U postgres -c "
    SELECT relname,
           n_dead_tup,
           n_live_tup,
           last_vacuum,
           last_autovacuum
    FROM pg_stat_user_tables
    WHERE relname IN ('fluentbit', 'sidekick_logs');
  "
The following shows a sample output. Note that he setting n_dead_tup should be 0 or very low after a successful VACUUM FULL.
 relname  | n_dead_tup | n_live_tup | last_vacuum |        last_autovacuum
-----------+------------+------------+-------------+-------------------------------
 fluentbit |          0 |       1004 |             | 2026-01-17 16:00:24.672247+00
Recreate the Emergency Buffer
Once disk pressure is resolved, restart the Postgres pod so the postStart hook recreates the buffer file via the following commands.
kubectl rollout restart deployment/postgres -n $NAMESPACE
kubectl rollout status deployment/postgres -n $NAMESPACE
The following shows standard execution of these commands.
❯ kubectl rollout restart deployment/postgres -n $NAMESPACE
deployment.apps/postgres restarted
❯ kubectl rollout status deployment/postgres -n $NAMESPACE
Waiting for deployment "postgres" rollout to finish: 0 of 1 updated replicas are available...
deployment "postgres" successfully rolled out
Verify the buffer was recreated via the following commands.
NEW_PG_POD=$(kubectl get pod -n $NAMESPACE -l role=postgres -o name | head -1)
kubectl exec -n $NAMESPACE $NEW_PG_POD -- \
  ls -lh /var/lib/postgresql/data/emergency_buffer.bin
Note: If the pod does not have enough free space to allocate the buffer, the postStart hook logs a warning and continues execution. Ensure at least emergencyBufferSize (default 5Gi) of free space is available before restarting, or repeat steps 3–4 until enough space is reclaimed.
If the Problem Recurs
If log tables are growing faster than the cleaner can keep up, consider adjusting these Helm values:
| Value | Default | Effect |
|---|---|---|
| dbcleaner.schedule | */8 * * * * | Increase frequency (e.g. */2 * * * *) |
| dbcleaner.maxAgeDays | -- | Reduce to retain fewer days of logs |
| dbcleaner.safetyPercentage | 0.85 | Lower to trigger cleanup earlier |
| dbcleaner.targetPercentage | 0.70 | Lower to clean more aggressively |
| postgres.diskSize | 100Gi | Expand the PVC if more retention is needed |