Viewing Detected Anomalies via the Wallaroo Dashboard
Wallaroo provides validations: user defined expressions on model inference input and outputs that determine if data falls outside expected norms. For more details on adding validations to a Wallaroo pipeline, see Detecting Anomalies with Validations via the Wallaroo SDK.
Detected anomaly analytics are available through the Wallaroo Dashboard user interface for each pipeline.
Access the Pipeline Analytics Page
To access a pipeline’s analytics page:
- From the Wallaroo Dashboard, select the workspace, then the View Pipelines to view.
- Select the pipeline to view.
- From the pipeline page, select Analytics.
The following analytics options are available.
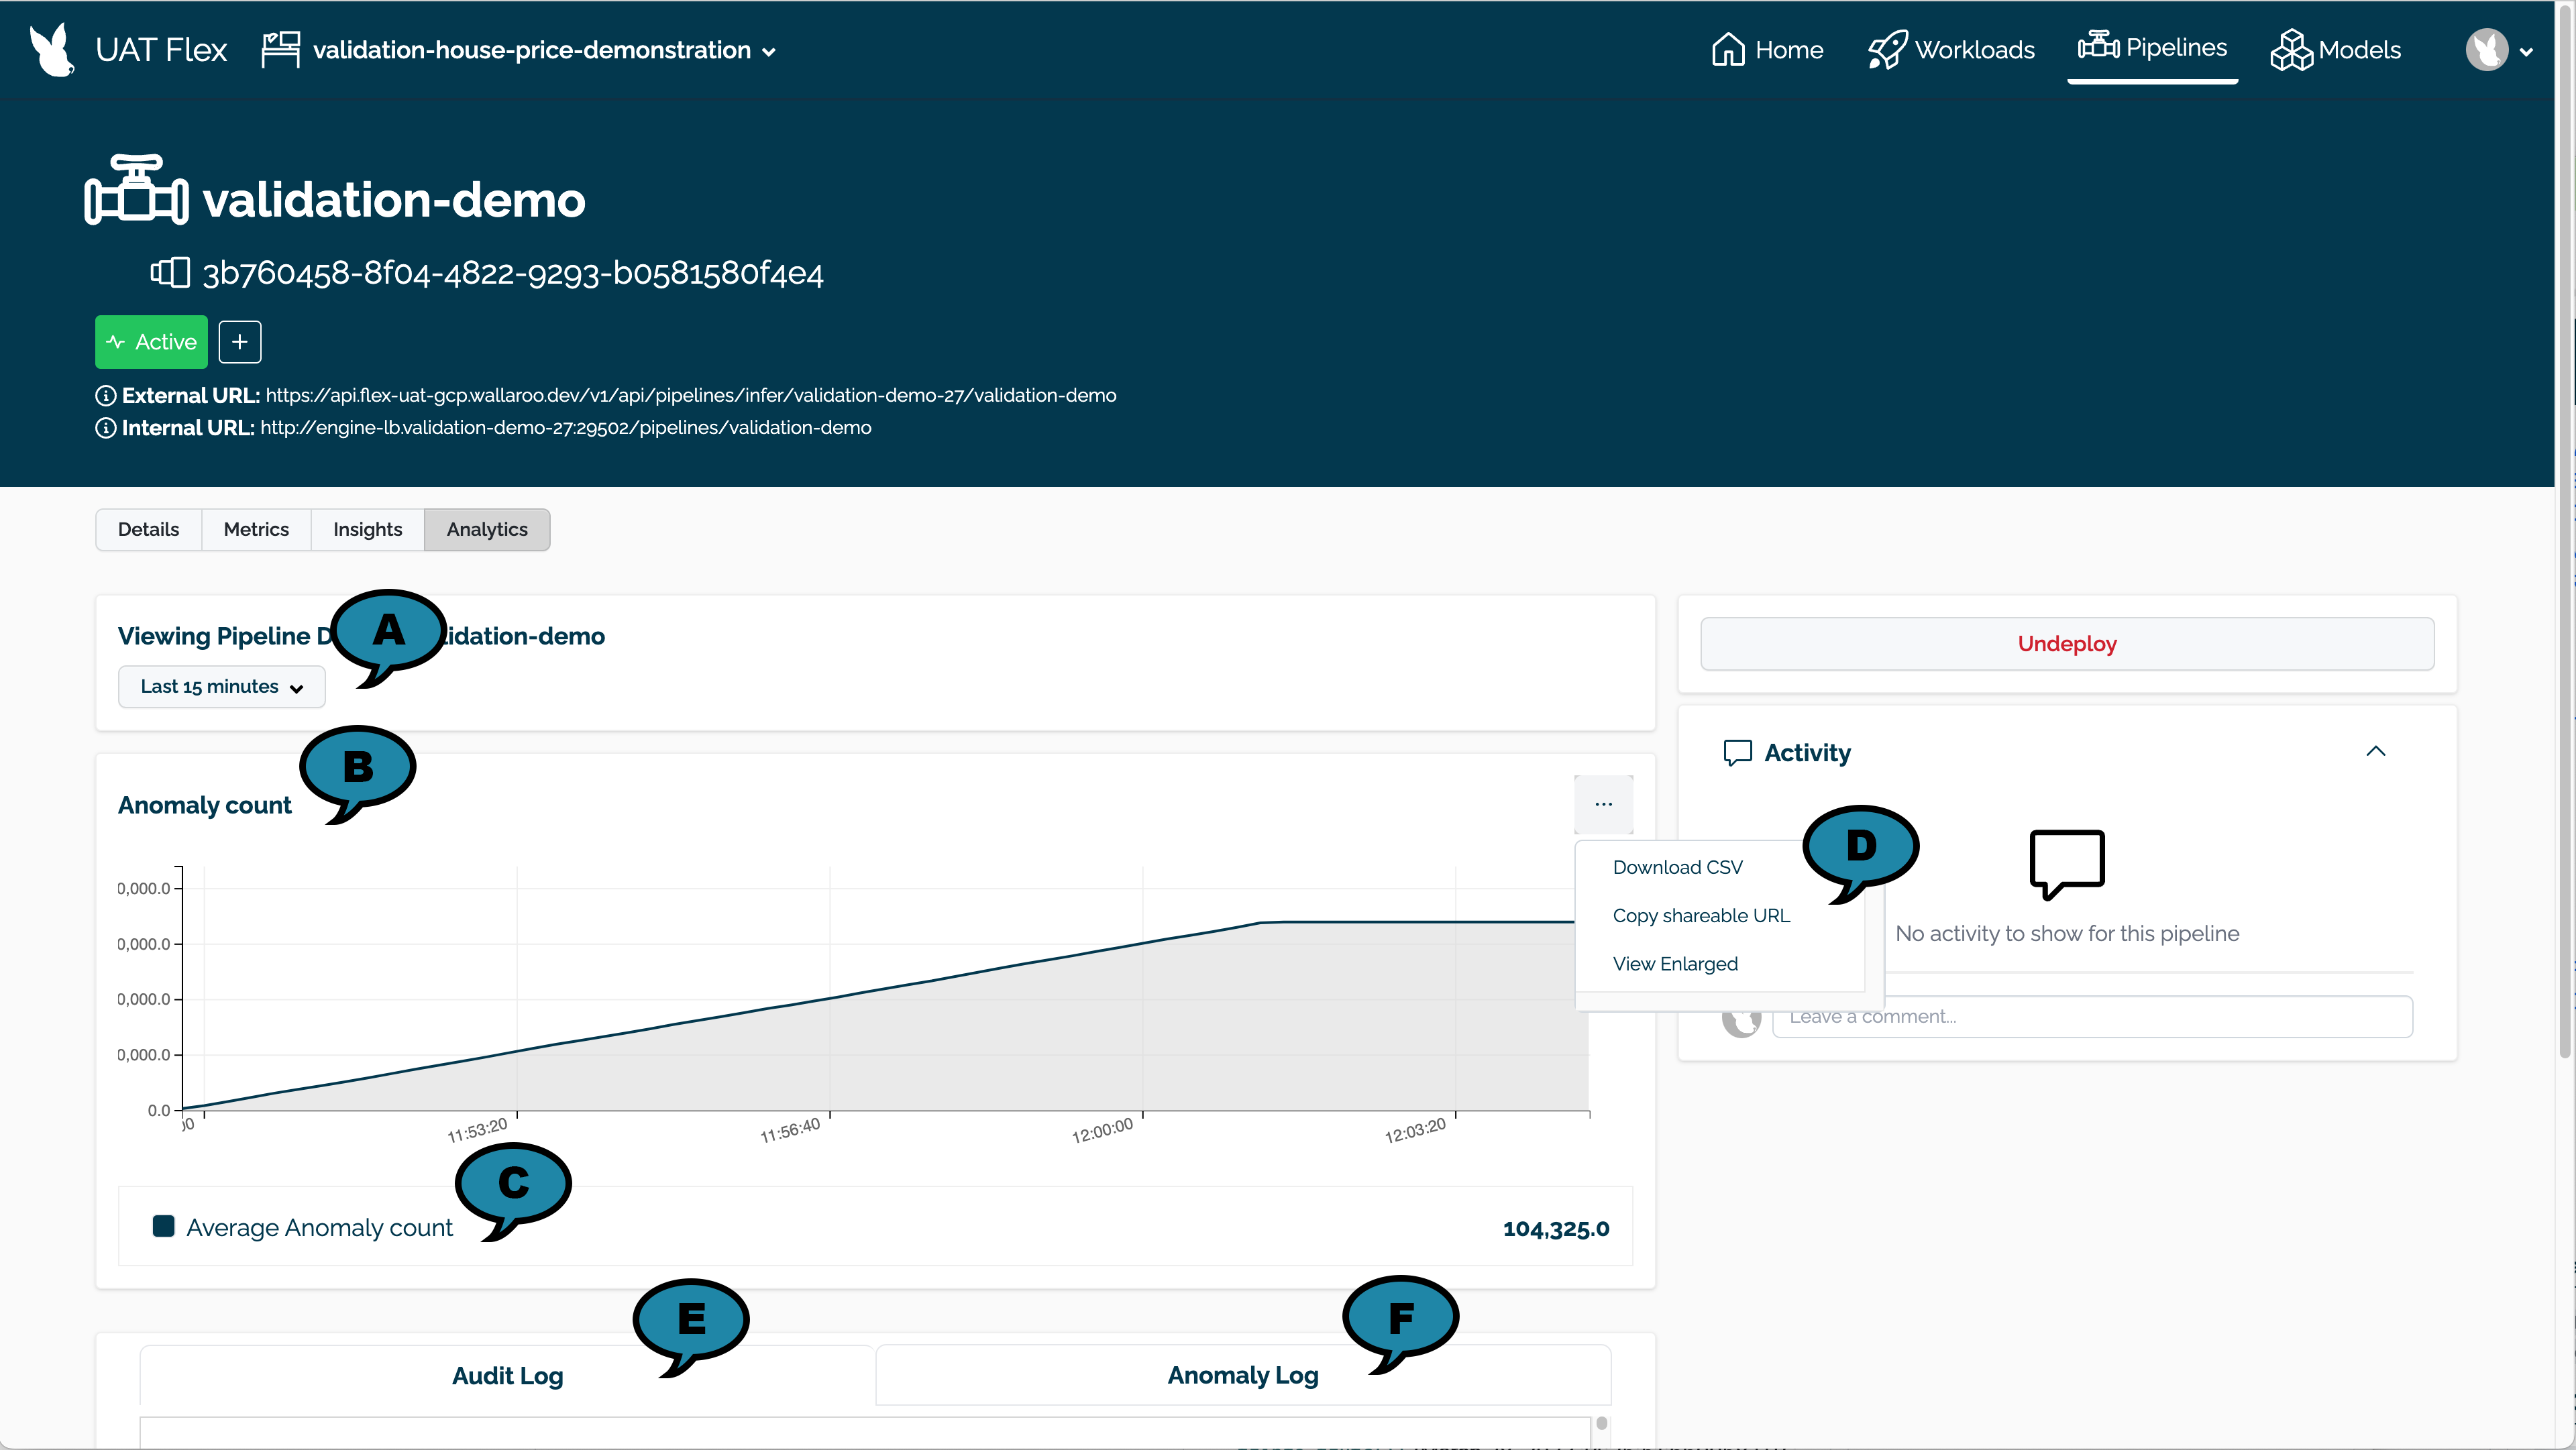
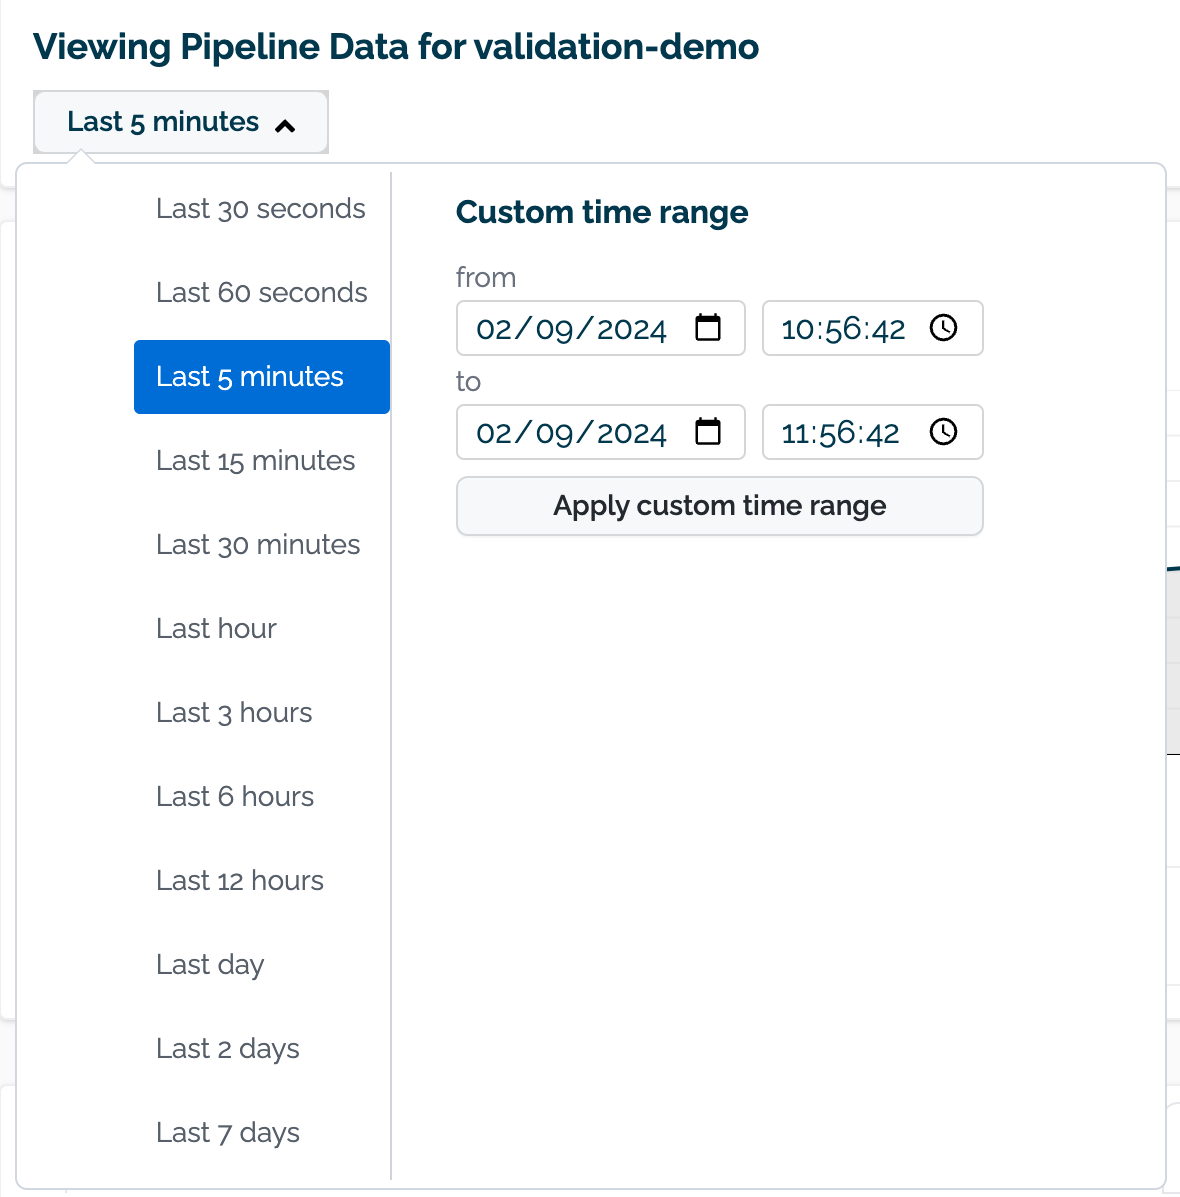
(A) Time Filter: Select the time range of inference requests to filter.
(B) Anomaly Count: A chart of the count of anomalies detected from inference requests over time.
(C) Average Anomaly Count: The average number of anomaly’s detected over the filtered time range.
(D) Actions: The following actions are available:
- Download CSV: Download a CSV of the anomaly counts shown in the chart.
- Copy sharable URL: Copy a URL of the anomaly count data shared with other registered Wallaroo instance users.
- View Enlarged: View an enlarged version of the anomaly count chart..
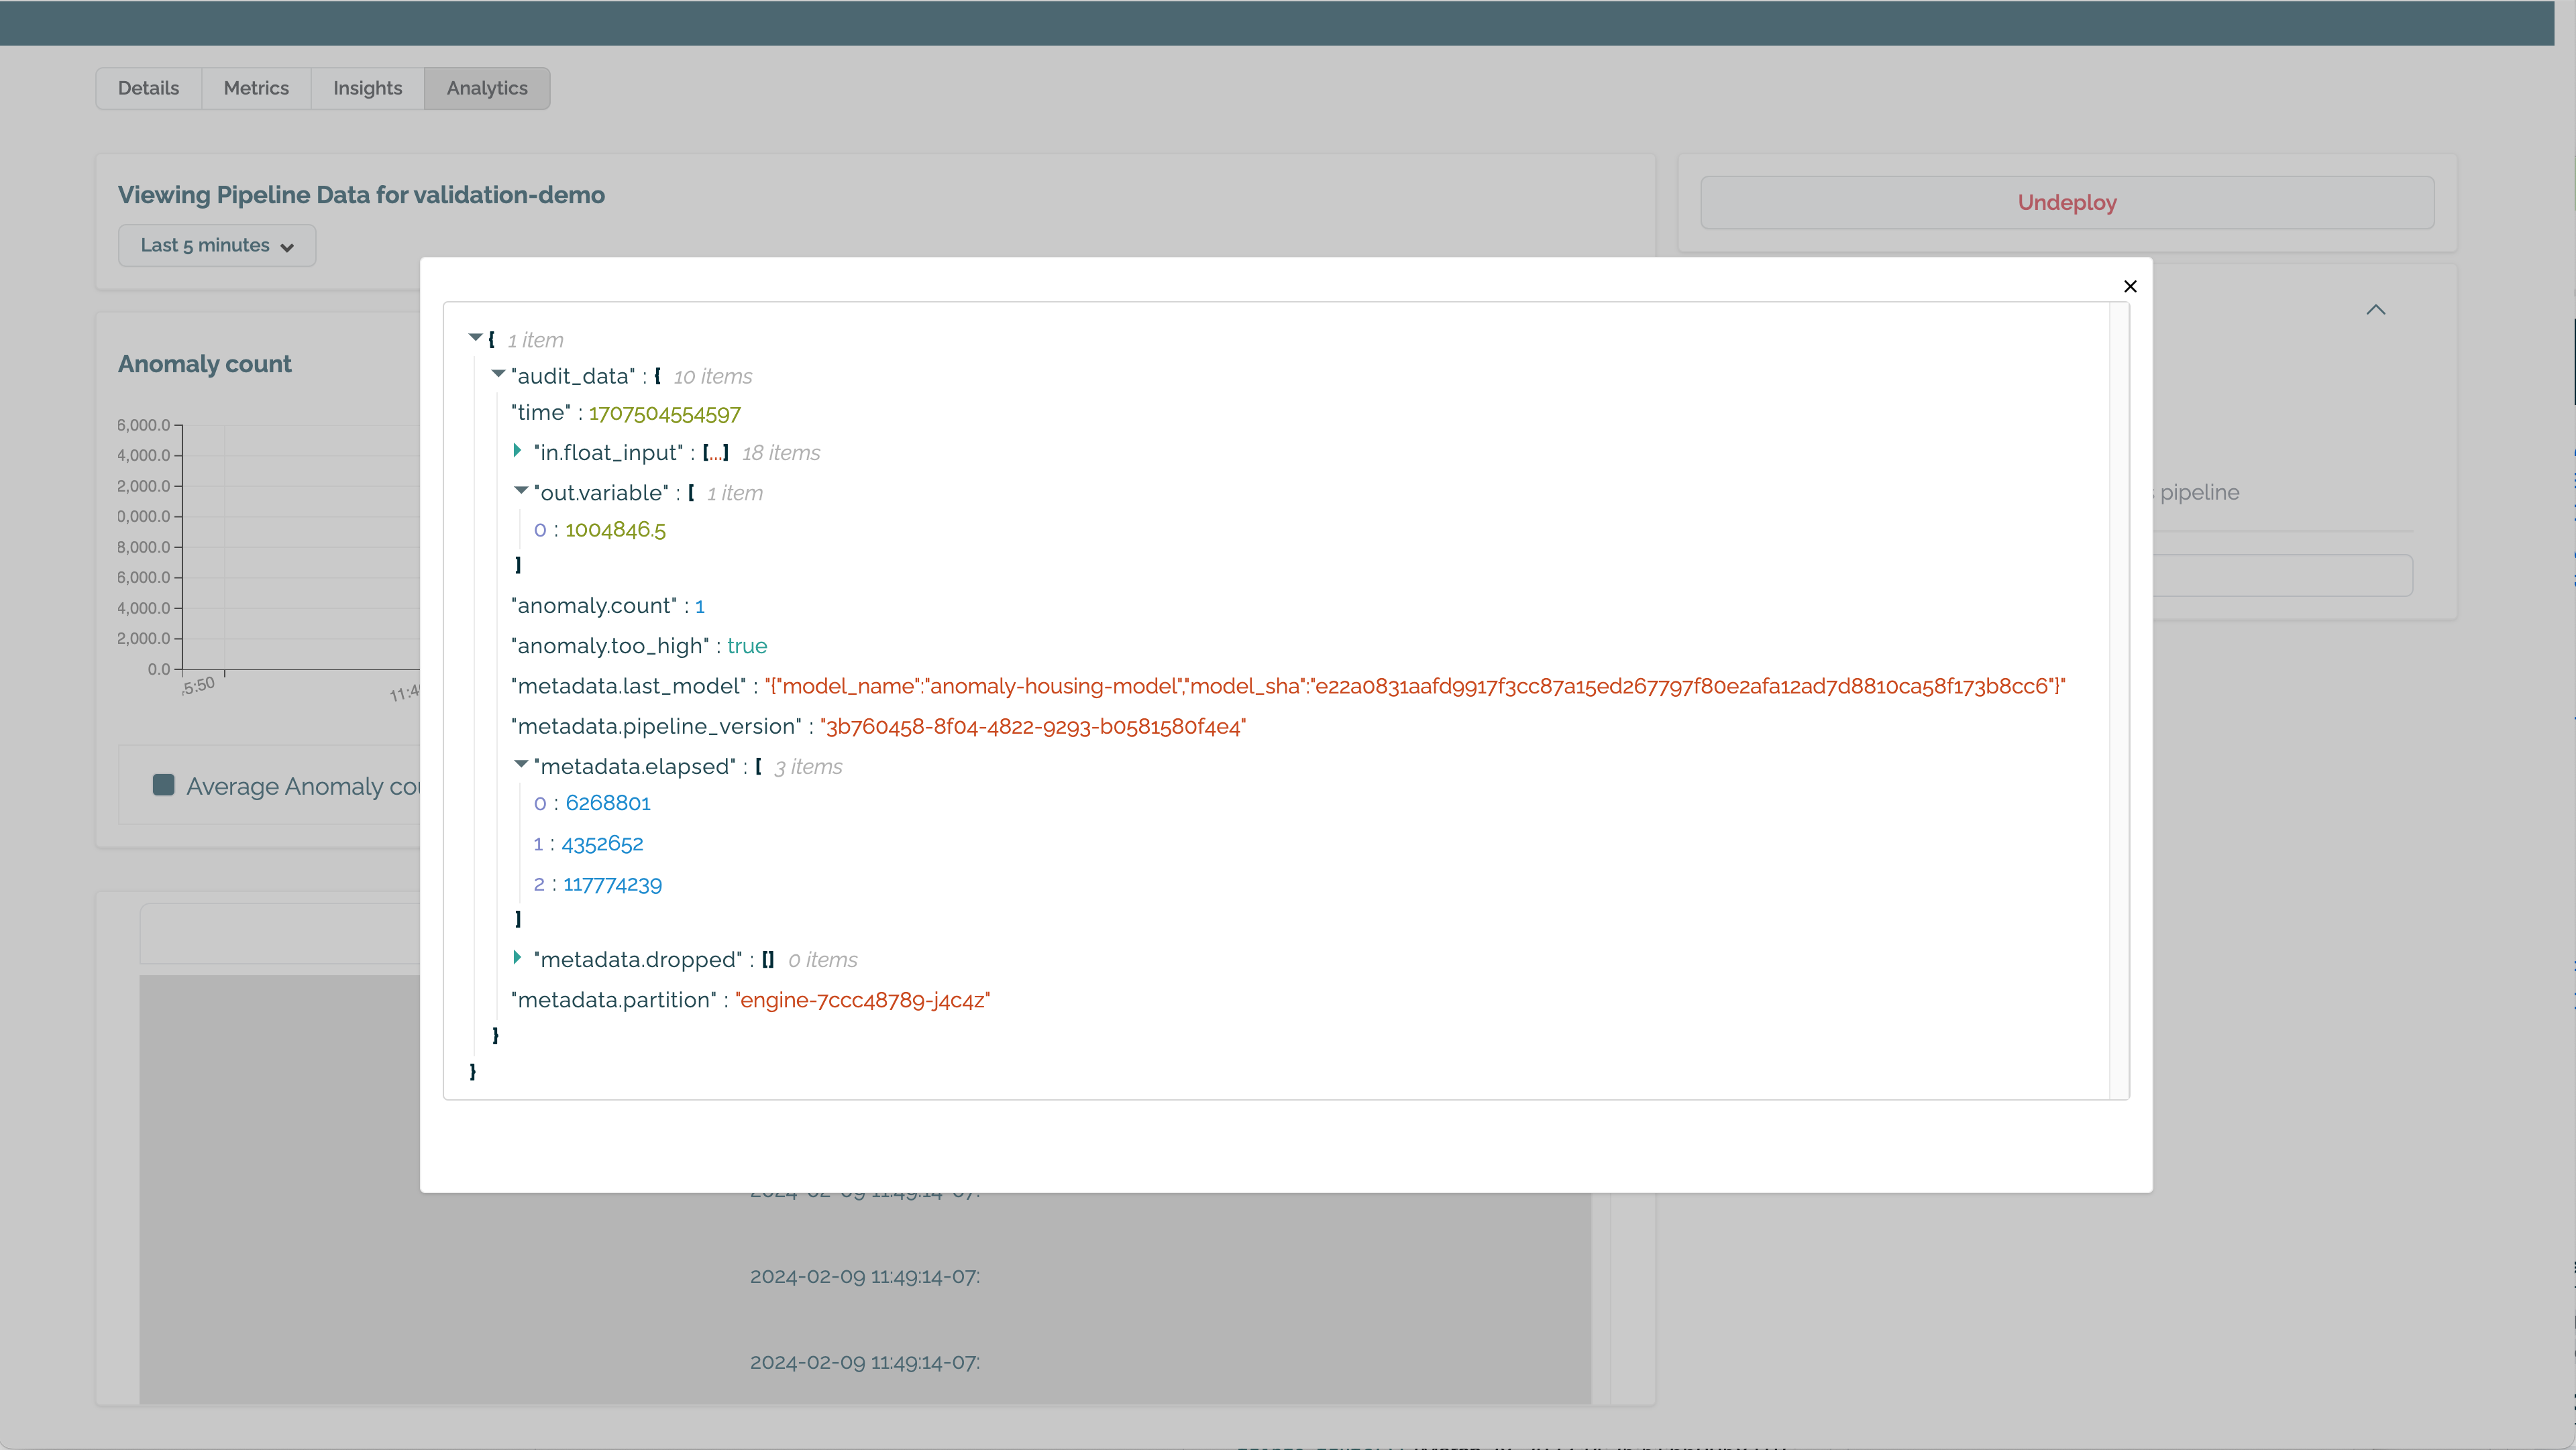
(E) Audit Log: Logs of all inference requests over the filtered time period.
(F) Anomaly Log: Logs of inference requests with a detected anomaly over the filtered time period.
Detecting Anomalies with Validations via the Wallaroo SDK
Wallaroo provides validations to detect anomalous data from inference inputs and outputs.
Validations are added to a Wallaroo pipeline with the wallaroo.pipeline.add_validations method.
- IMPORTANT NOTE: Validation names must be unique per pipeline. If a validation of the same name is added, both are included in the pipeline validations, but only most recent validation with the same name is displayed with the inference results. Anomalies detected by multiple validations of the same name are added to the
anomaly.countinference result field.
Adding validations to a pipeline takes the format:
pipeline.add_validations(
    validation_name_01 = polars.col(in|out.{column_name}) EXPRESSION,
    validation_name_02 = polars.col(in|out.{column_name}) EXPRESSION
    ...{additional rules}
)
validation_name: The user provided name of the validation. The names must match Python variable naming requirements.- IMPORTANT NOTE: Using the name
countas a validation name returns an error. Any validation rules namedcountare dropped upon request and a warning returned.
- IMPORTANT NOTE: Using the name
polars.col(in|out.{column_name}): Specifies the input or output for a specific field aka “column” in an inference result. Wallaroo inference requests are in the formatin.{field_name}for inputs, andout.{field_name}for outputs.- More than one field can be selected, as long as they follow the rules of the polars 0.18 Expressions library.
EXPRESSION: The expression to validate. When the expression returns True, that indicates an anomaly detected.
The polars library version 0.18.5 is used to create the validation rule. This is installed by default with the Wallaroo SDK. This provides a powerful range of comparisons to organizations tracking anomalous data from their ML models.
When validations are added to a pipeline, inference request outputs return the following fields:
| Field | Type | Description |
|---|---|---|
| anomaly.count | Integer | The total of all validations that returned True. |
| anomaly.{validation name} | Bool | The output of the validation {validation_name}. |
When validation returns True, an anomaly is detected.
For example, adding the validation fraud to the following pipeline returns anomaly.count of 1 when the validation fraud returns True. The validation fraud returns True when the output field dense_1 at index 0 is greater than 0.9.
sample_pipeline = wallaroo.client.build_pipeline("sample-pipeline")
sample_pipeline.add_model_step(ccfraud_model)

# add the validation
sample_pipeline.add_validations(
    fraud=pl.col("out.dense_1").list.get(0) > 0.9,
    )

# deploy the pipeline
sample_pipeline.deploy()

# sample inference
display(sample_pipeline.infer_from_file("dev_high_fraud.json", data_format='pandas-records'))
| time | in.tensor | out.dense_1 | anomaly.count | anomaly.fraud | |
|---|---|---|---|---|---|
| 0 | 2024-02-02 16:05:42.152 | [1.0678324729, 18.1555563975, -1.6589551058, 5…] | [0.981199] | 1 | True |
Detecting Anomalies from Inference Request Results
When an inference request is submitted to a Wallaroo pipeline with validations, the following fields are output:
| Field | Type | Description |
|---|---|---|
| anomaly.count | Integer | The total of all validations that returned True. |
| anomaly.{validation name} | Bool | The output of each pipeline validation {validation_name}. |
For example, adding the validation fraud to the following pipeline returns anomaly.count of 1 when the validation fraud returns True.
sample_pipeline = wallaroo.client.build_pipeline("sample-pipeline")
sample_pipeline.add_model_step(ccfraud_model)

# add the validation
sample_pipeline.add_validations(
    fraud=pl.col("out.dense_1").list.get(0) > 0.9,
    )

# deploy the pipeline
sample_pipeline.deploy()

# sample inference
display(sample_pipeline.infer_from_file("dev_high_fraud.json", data_format='pandas-records'))
| time | in.tensor | out.dense_1 | anomaly.count | anomaly.fraud | |
|---|---|---|---|---|---|
| 0 | 2024-02-02 16:05:42.152 | [1.0678324729, 18.1555563975, -1.6589551058, 5…] | [0.981199] | 1 | True |
Validation Examples
Common Data Selection Expressions
The following sample expressions demonstrate different methods of selecting which model input or output data to validate.
polars.col(in|out.{column_name}).list.get(index): Returns the index of a specific field. For example,pl.col("out.dense_1")returns from the inference the output the field dense_1, andlist.get(0)returns the first value in that list. Most output values from a Wallaroo inference result are a List of at least length 1, making this a common validation expression.polars.col(in.price_ranges).list.max(): Returns from the inference request the input field price_ranges the maximum value from a list of values.polars.col(out.price_ranges).mean()returns the mean for all values from the output fieldprice_ranges.
For example, to the following validation fraud detects values for the output of an inference request for the field dense_1 that are greater than 0.9, indicating a transaction has a high likelihood of fraud:
import polars as pl

pipeline.add_validations(
    fraud = fraud=pl.col("out.dense_1").list.get(0) > 0.9
)
The following inference output shows the detected anomaly from an inference output:
| time | in.tensor | out.dense_1 | anomaly.count | anomaly.fraud | |
|---|---|---|---|---|---|
| 0 | 2024-02-02 16:05:42.152 | [1.0678324729, 18.1555563975, -1.6589551058, 5… | [0.981199] | 1 | True |
Detecting Input Anomalies
The following validation tests the inputs from sales figures for a week’s worth of sales:
| week | site_id | sales_count | |
|---|---|---|---|
| 0 | [28] | [site0001] | [1357, 1247, 350, 1437, 952, 757, 1831] |
To validate that any sales figure does not go below 500 units, the validation is:
import polars as pl

pipeline.add_validations(
    minimum_sales=pl.col("in.sales_count").list.min() < 500
)

pipeline.deploy()

pipeline.infer_from_file(previous_week_sales)
For the input provided, the minimum_sales validation would return True, indicating an anomaly.
| time | out.predicted_sales | anomaly.count | anomaly.minimum_sales | |
|---|---|---|---|---|
| 0 | 2023-10-31 16:57:13.771 | [1527] | 1 | True |
Detecting Output Anomalies
The following validation detects an anomaly from a output.
fraud: Detects when an inference output for the fielddense_1at index0is greater than 0.9, indicating fraud.
# create the pipeline
sample_pipeline = wallaroo.client.build_pipeline("sample-pipeline")

# add a model step
sample_pipeline.add_model_step(ccfraud_model)

# add validations to the pipeline
sample_pipeline.add_validations(
    fraud=pl.col("out.dense_1").list.get(0) > 0.9
    )
sample_pipeline.deploy()

sample_pipeline.infer_from_file("dev_high_fraud.json")
| time | in.tensor | out.dense_1 | anomaly.count | anomaly.fraud | |
|---|---|---|---|---|---|
| 0 | 2024-02-02 16:05:42.152 | [1.0678324729, 18.1555563975, -1.6589551058, 5... | [0.981199] | 1 | True |
Multiple Validations
The following demonstrates multiple validations added to a pipeline at once and their results from inference requests. Two validations that track the same output field and index are applied to a pipeline:
fraud: Detects an anomaly when the inference output fielddense_1at index0value is greater than0.9.too_low: Detects an anomaly when the inference output fielddense_1at the index0value is lower than0.05.
sample_pipeline.add_validations(
    fraud=pl.col("out.dense_1").list.get(0) > 0.9,
    too_low=pl.col("out.dense_1").list.get(0) < 0.05
    )
Two separate inferences where the output of the first is over 0.9 and the second is under 0.05 would be the following.
sample_pipeline.infer_from_file("high_fraud_example.json")
| time | in.tensor | out.dense_1 | anomaly.count | anomaly.fraud | anomaly.too_low | |
|---|---|---|---|---|---|---|
| 0 | 2024-02-02 16:05:42.152 | [1.0678324729, 18.1555563975, -1.6589551058, 5… | [0.981199] | 1 | True | False |
sample_pipeline.infer_from_file("low_fraud_example.json")
| time | in.tensor | out.dense_1 | anomaly.count | anomaly.fraud | anomaly.too_low | |
|---|---|---|---|---|---|---|
| 0 | 2024-02-02 16:05:38.452 | [1.0678324729, 0.2177810266, -1.7115145262, 0…. | [0.0014974177] | 1 | False | True |
The following example tracks two validations for a model that takes the previous week’s sales and projects the next week’s average sales with the field predicted_sales.
minimum_sales=pl.col("in.sales_count").list.min() < 500: The input fieldsales_countwith a range of values has any minimum value under500.average_sales_too_low=pl.col("out.predicted_sales").list.get(0) < 500: The output fieldpredicted_salesis less than500.
The following inputs return the following values. Note how the anomaly.count value changes by the number of validations that detect an anomaly.
Input 1:
In this example, one day had sales under 500, which triggers the minimum_sales validation to return True. The predicted sales are above 500, causing the average_sales_too_low validation to return False.
| week | site_id | sales_count | |
|---|---|---|---|
| 0 | [28] | [site0001] | [1357, 1247, 350, 1437, 952, 757, 1831] |
Output 1:
| time | out.predicted_sales | anomaly.count | anomaly.minimum_sales | anomaly.average_sales_too_low | |
|---|---|---|---|---|---|
| 0 | 2023-10-31 16:57:13.771 | [1527] | 1 | True | False |
Input 2:
In this example, multiple days have sales under 500, which triggers the minimum_sales validation to return True. The predicted average sales for the next week are above 500, causing the average_sales_too_low validation to return True.
| week | site_id | sales_count | |
|---|---|---|---|
| 0 | [29] | [site0001] | [497, 617, 350, 200, 150, 400, 110] |
Output 2:
| time | out.predicted_sales | anomaly.count | anomaly.minimum_sales | anomaly.average_sales_too_low | |
|---|---|---|---|---|---|
| 0 | 2023-10-31 16:57:13.771 | [325] | 2 | True | True |
Input 3:
In this example, no sales day figures are below 500, which triggers the minimum_sales validation to return False. The predicted sales for the next week is below 500, causing the average_sales_too_low validation to return True.
| week | site_id | sales_count | |
|---|---|---|---|
| 0 | [30] | [site0001] | [617, 525, 513, 517, 622, 757, 508] |
Output 3:
| time | out.predicted_sales | anomaly.count | anomaly.minimum_sales | anomaly.average_sales_too_low | |
|---|---|---|---|---|---|
| 0 | 2023-10-31 16:57:13.771 | [497] | 1 | False | True |
Compound Validations
The following combines multiple field checks into a single validation. For this, we will check for values of out.dense_1 that are between 0.05 and 0.9.
Each expression is separated by (). For example:
- Expression 1:
pl.col("out.dense_1").list.get(0) < 0.9 - Expression 2:
pl.col("out.dense_1").list.get(0) > 0.001 - Compound Expression:
(pl.col("out.dense_1").list.get(0) < 0.9) & (pl.col("out.dense_1").list.get(0) > 0.001)
sample_pipeline = sample_pipeline.add_validations(
    in_between_2=(pl.col("out.dense_1").list.get(0) < 0.9) & (pl.col("out.dense_1").list.get(0) > 0.001)
)

results = sample_pipeline.infer_from_file("./data/cc_data_1k.df.json")

results.loc[results['anomaly.in_between_2'] == True]
| time | in.dense_input | out.dense_1 | anomaly.count | anomaly.fraud | anomaly.in_between_2 | anomaly.too_low | |
|---|---|---|---|---|---|---|---|
| 4 | 2024-02-08 17:48:49.305 | [0.5817662108, 0.097881551, 0.1546819424, 0.47... | [0.0010916889] | 1 | False | True | False |
| 7 | 2024-02-08 17:48:49.305 | [1.0379636346, -0.152987302, -1.0912561862, -0... | [0.0011294782] | 1 | False | True | False |
| 8 | 2024-02-08 17:48:49.305 | [0.1517283662, 0.6589966337, -0.3323713647, 0.... | [0.0018743575] | 1 | False | True | False |
| 9 | 2024-02-08 17:48:49.305 | [-0.1683100246, 0.7070470317, 0.1875234948, -0... | [0.0011520088] | 1 | False | True | False |
| 10 | 2024-02-08 17:48:49.305 | [0.6066235674, 0.0631839305, -0.0802961973, 0.... | [0.0016568303] | 1 | False | True | False |
| ... | ... | ... | ... | ... | ... | ... | ... |
| 982 | 2024-02-08 17:48:49.305 | [-0.0932906169, 0.2837744937, -0.061094265, 0.... | [0.0010192394] | 1 | False | True | False |
| 983 | 2024-02-08 17:48:49.305 | [0.0991458877, 0.5813808183, -0.3863062246, -0... | [0.0020678043] | 1 | False | True | False |
| 992 | 2024-02-08 17:48:49.305 | [1.0458395446, 0.2492453605, -1.5260449285, 0.... | [0.0013128221] | 1 | False | True | False |
| 998 | 2024-02-08 17:48:49.305 | [1.0046377125, 0.0343666504, -1.3512533246, 0.... | [0.0011070371] | 1 | False | True | False |
| 1000 | 2024-02-08 17:48:49.305 | [0.6118805301, 0.1726081102, 0.4310545502, 0.5... | [0.0012498498] | 1 | False | True | False |