Organizations that have installed Wallaroo using Microsoft Azure can integrate Azure Managed Grafana. This allows reports to be created tracking the performance of Wallaroo pipelines, overall cluster health, and other vital performance data benchmarks.
Create Azure Managed Grafana Workspace
To create a new Azure Managed Grafana Workspace:
Log into Microsoft Azure. From the Azure Services list, either select Azure Managed Grafana or search for
Azure Managed Grafanain the search bar.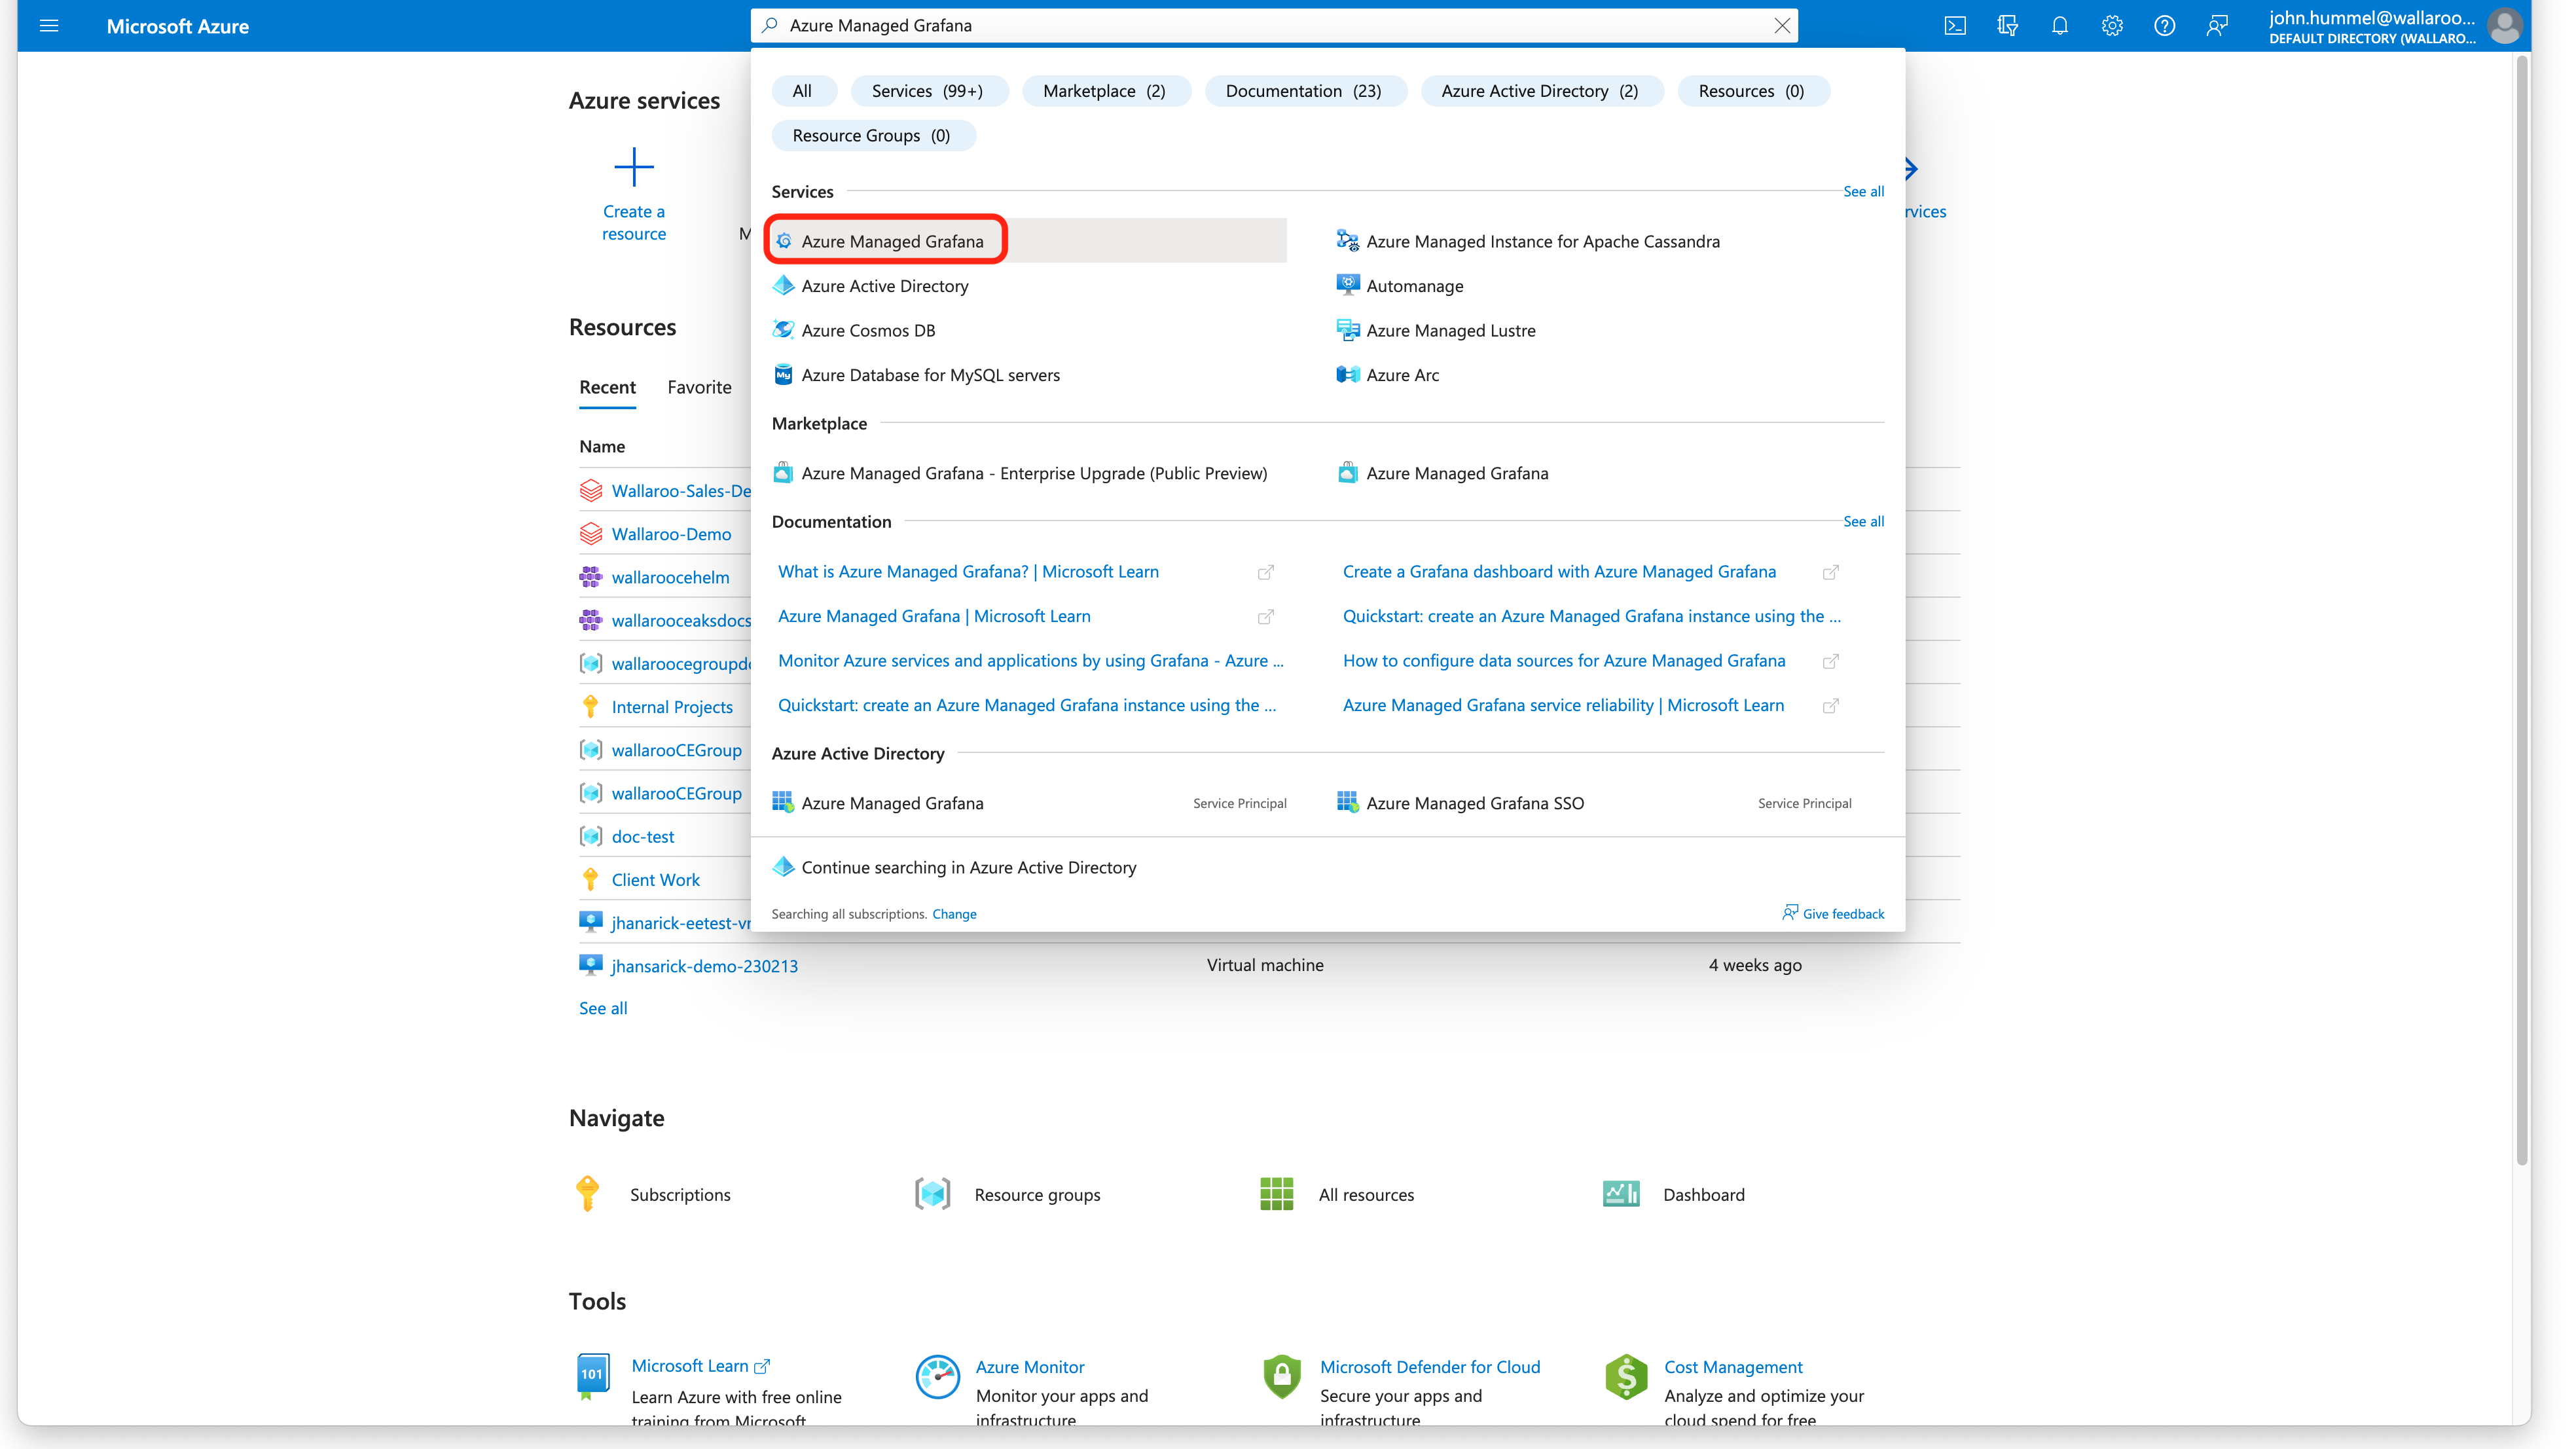
From the Azure Managed Grafana dashboard, select +Create.
Set the following minimum settings. Any other settings are up to the organization’s requirements.
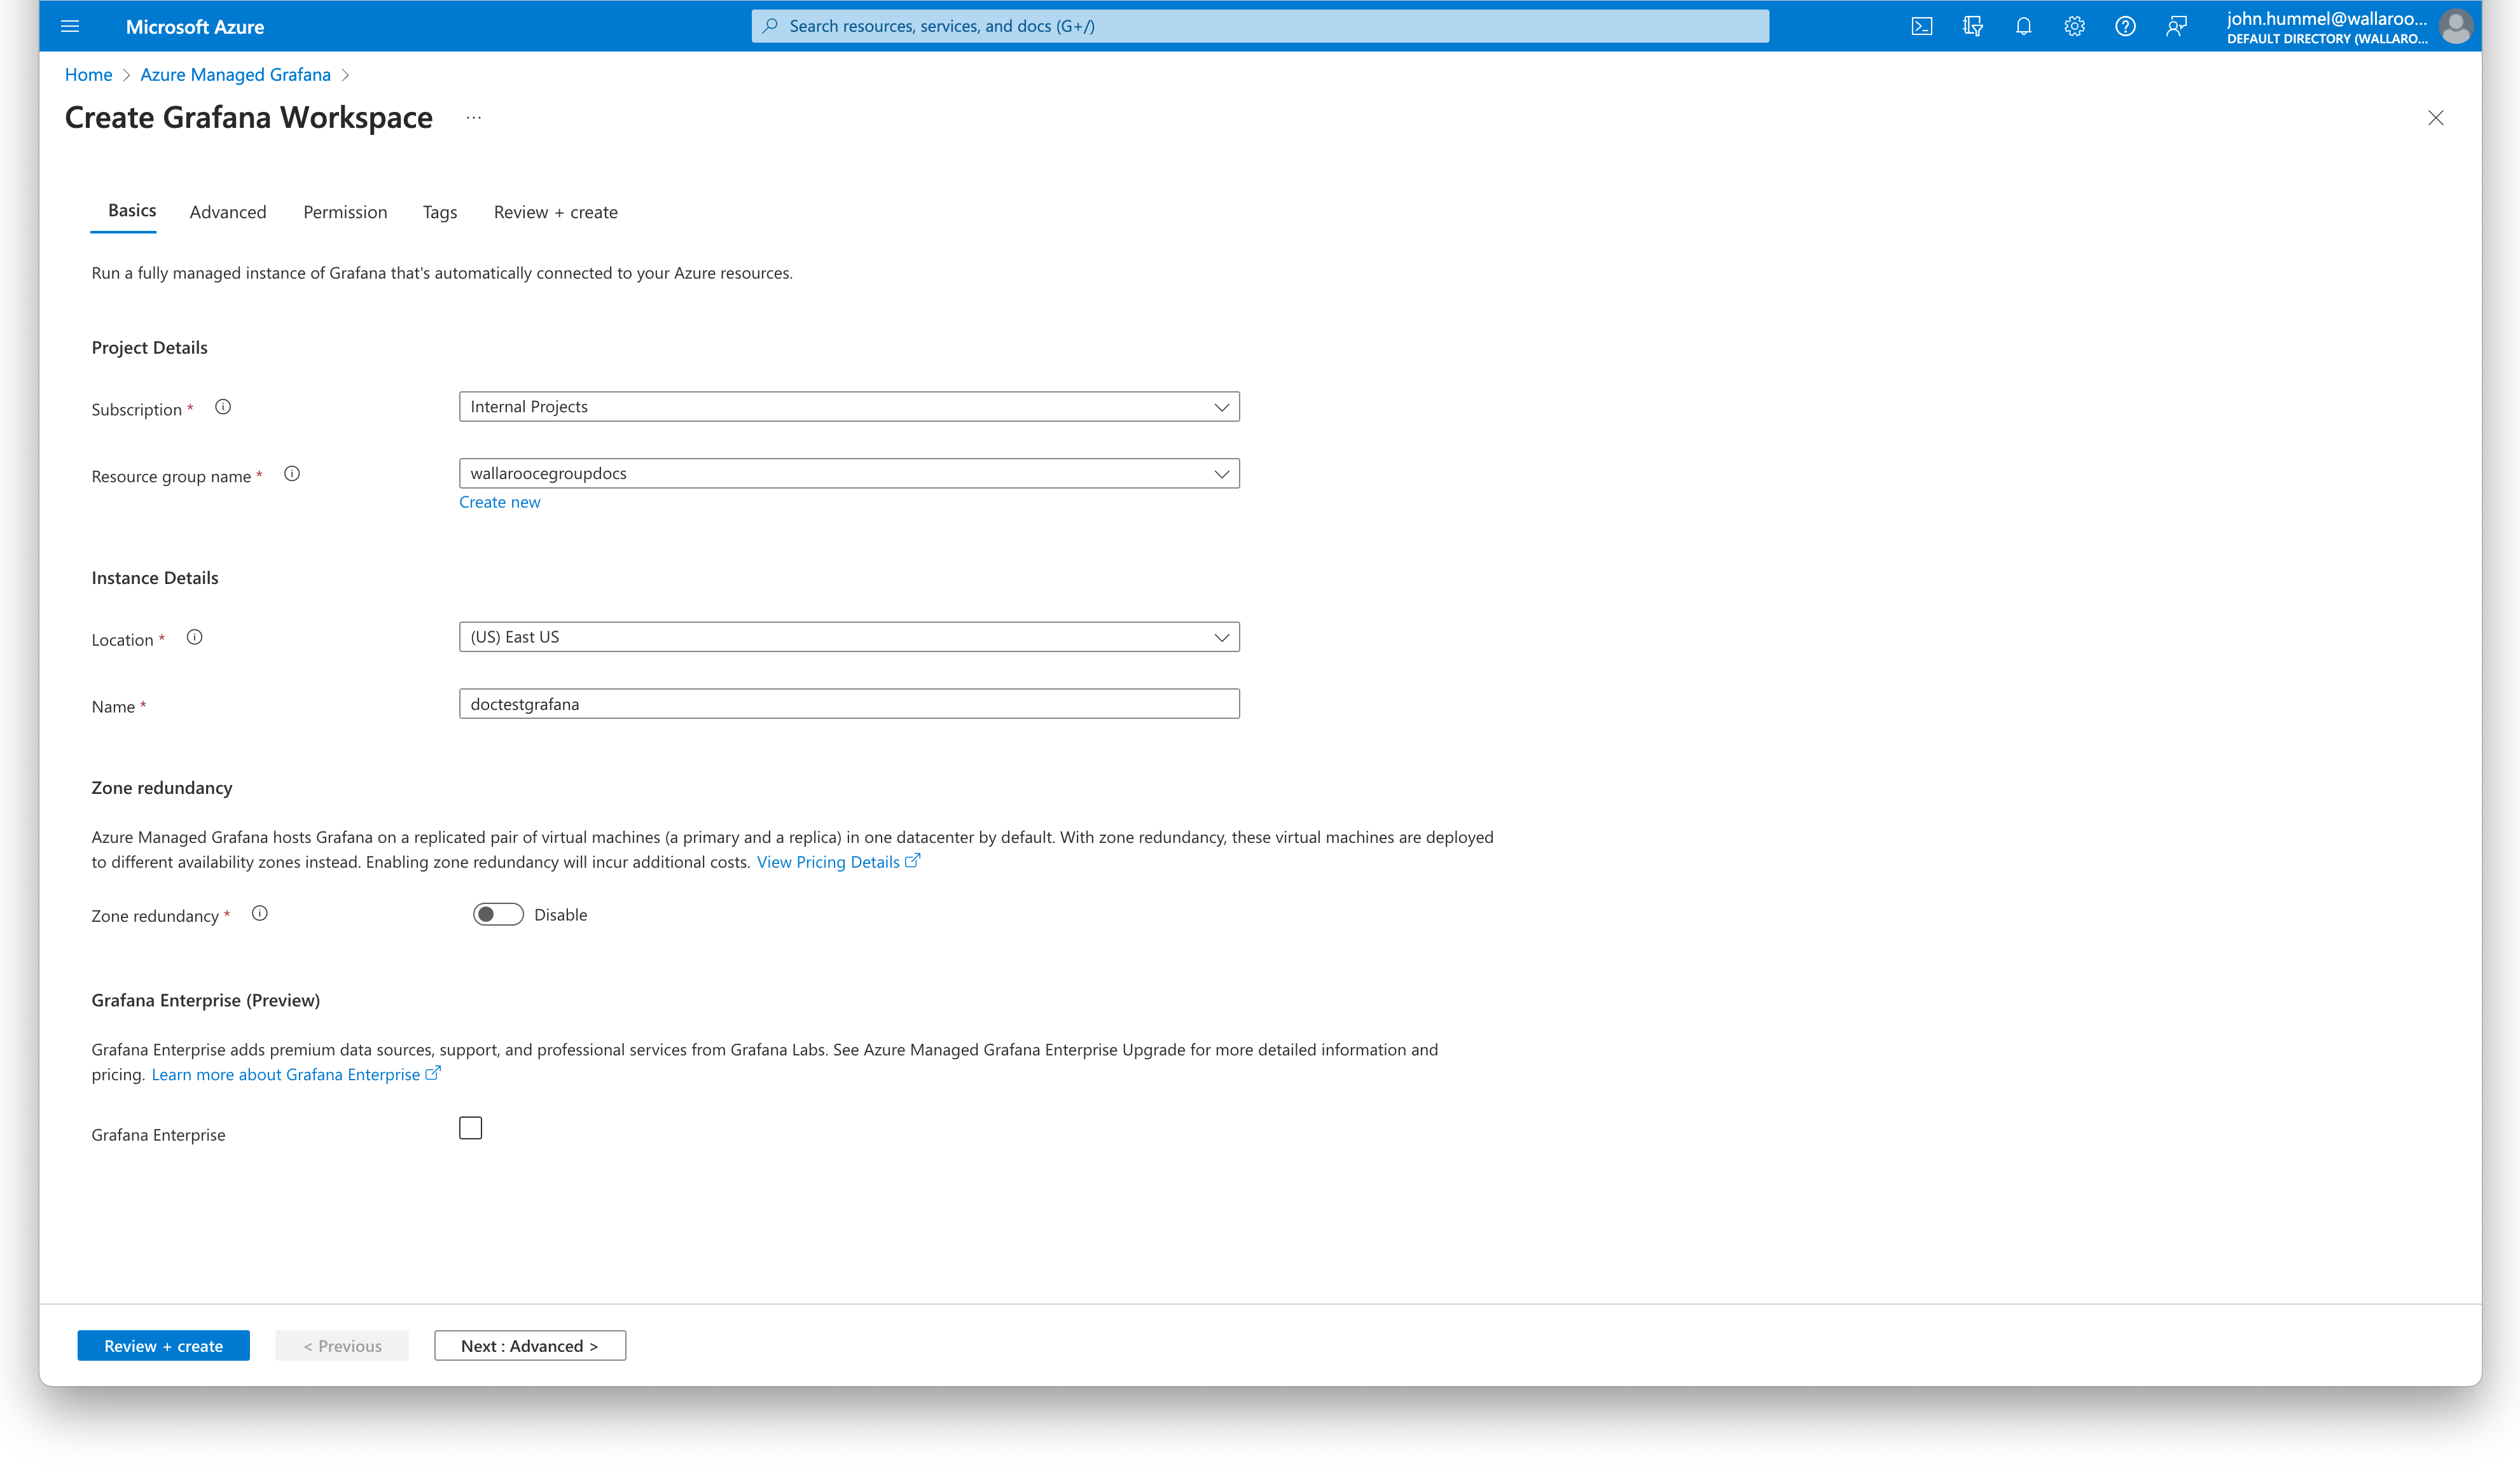
- Subscription: The subscription used for billing the Grafana workspace.
- Resource Group Name: Select from an existing or use Create new to create a new Azure Resource Group for managing permissions to the Grafana workspace.
- Instance Details
- Location: Where the Grafana workspace is hosted. It is recommended it be in the same location as the Kubernetes cluster hosting the Wallaroo instance.
- Name: The name of the Grafana workspace.
Select Review + create when finished. Review the settings, then select Create to complete the process.
Add Azure Managed Grafana Workspace to Microsoft Azure Kubernetes Cluster
To integrate an Azure Managed Grafana Workspace to a Microsoft Azure Kubernetes cluster for monitoring:
Log into Microsoft Azure. From the Azure Services list, either select Kubernetes Services or search for
Kubernetes Servicesin the search bar.From the Kubernetes services dashboard, select the cluster to monitor.
From the cluster dashboard, from the left navigation panel select Monitoring->Insights.
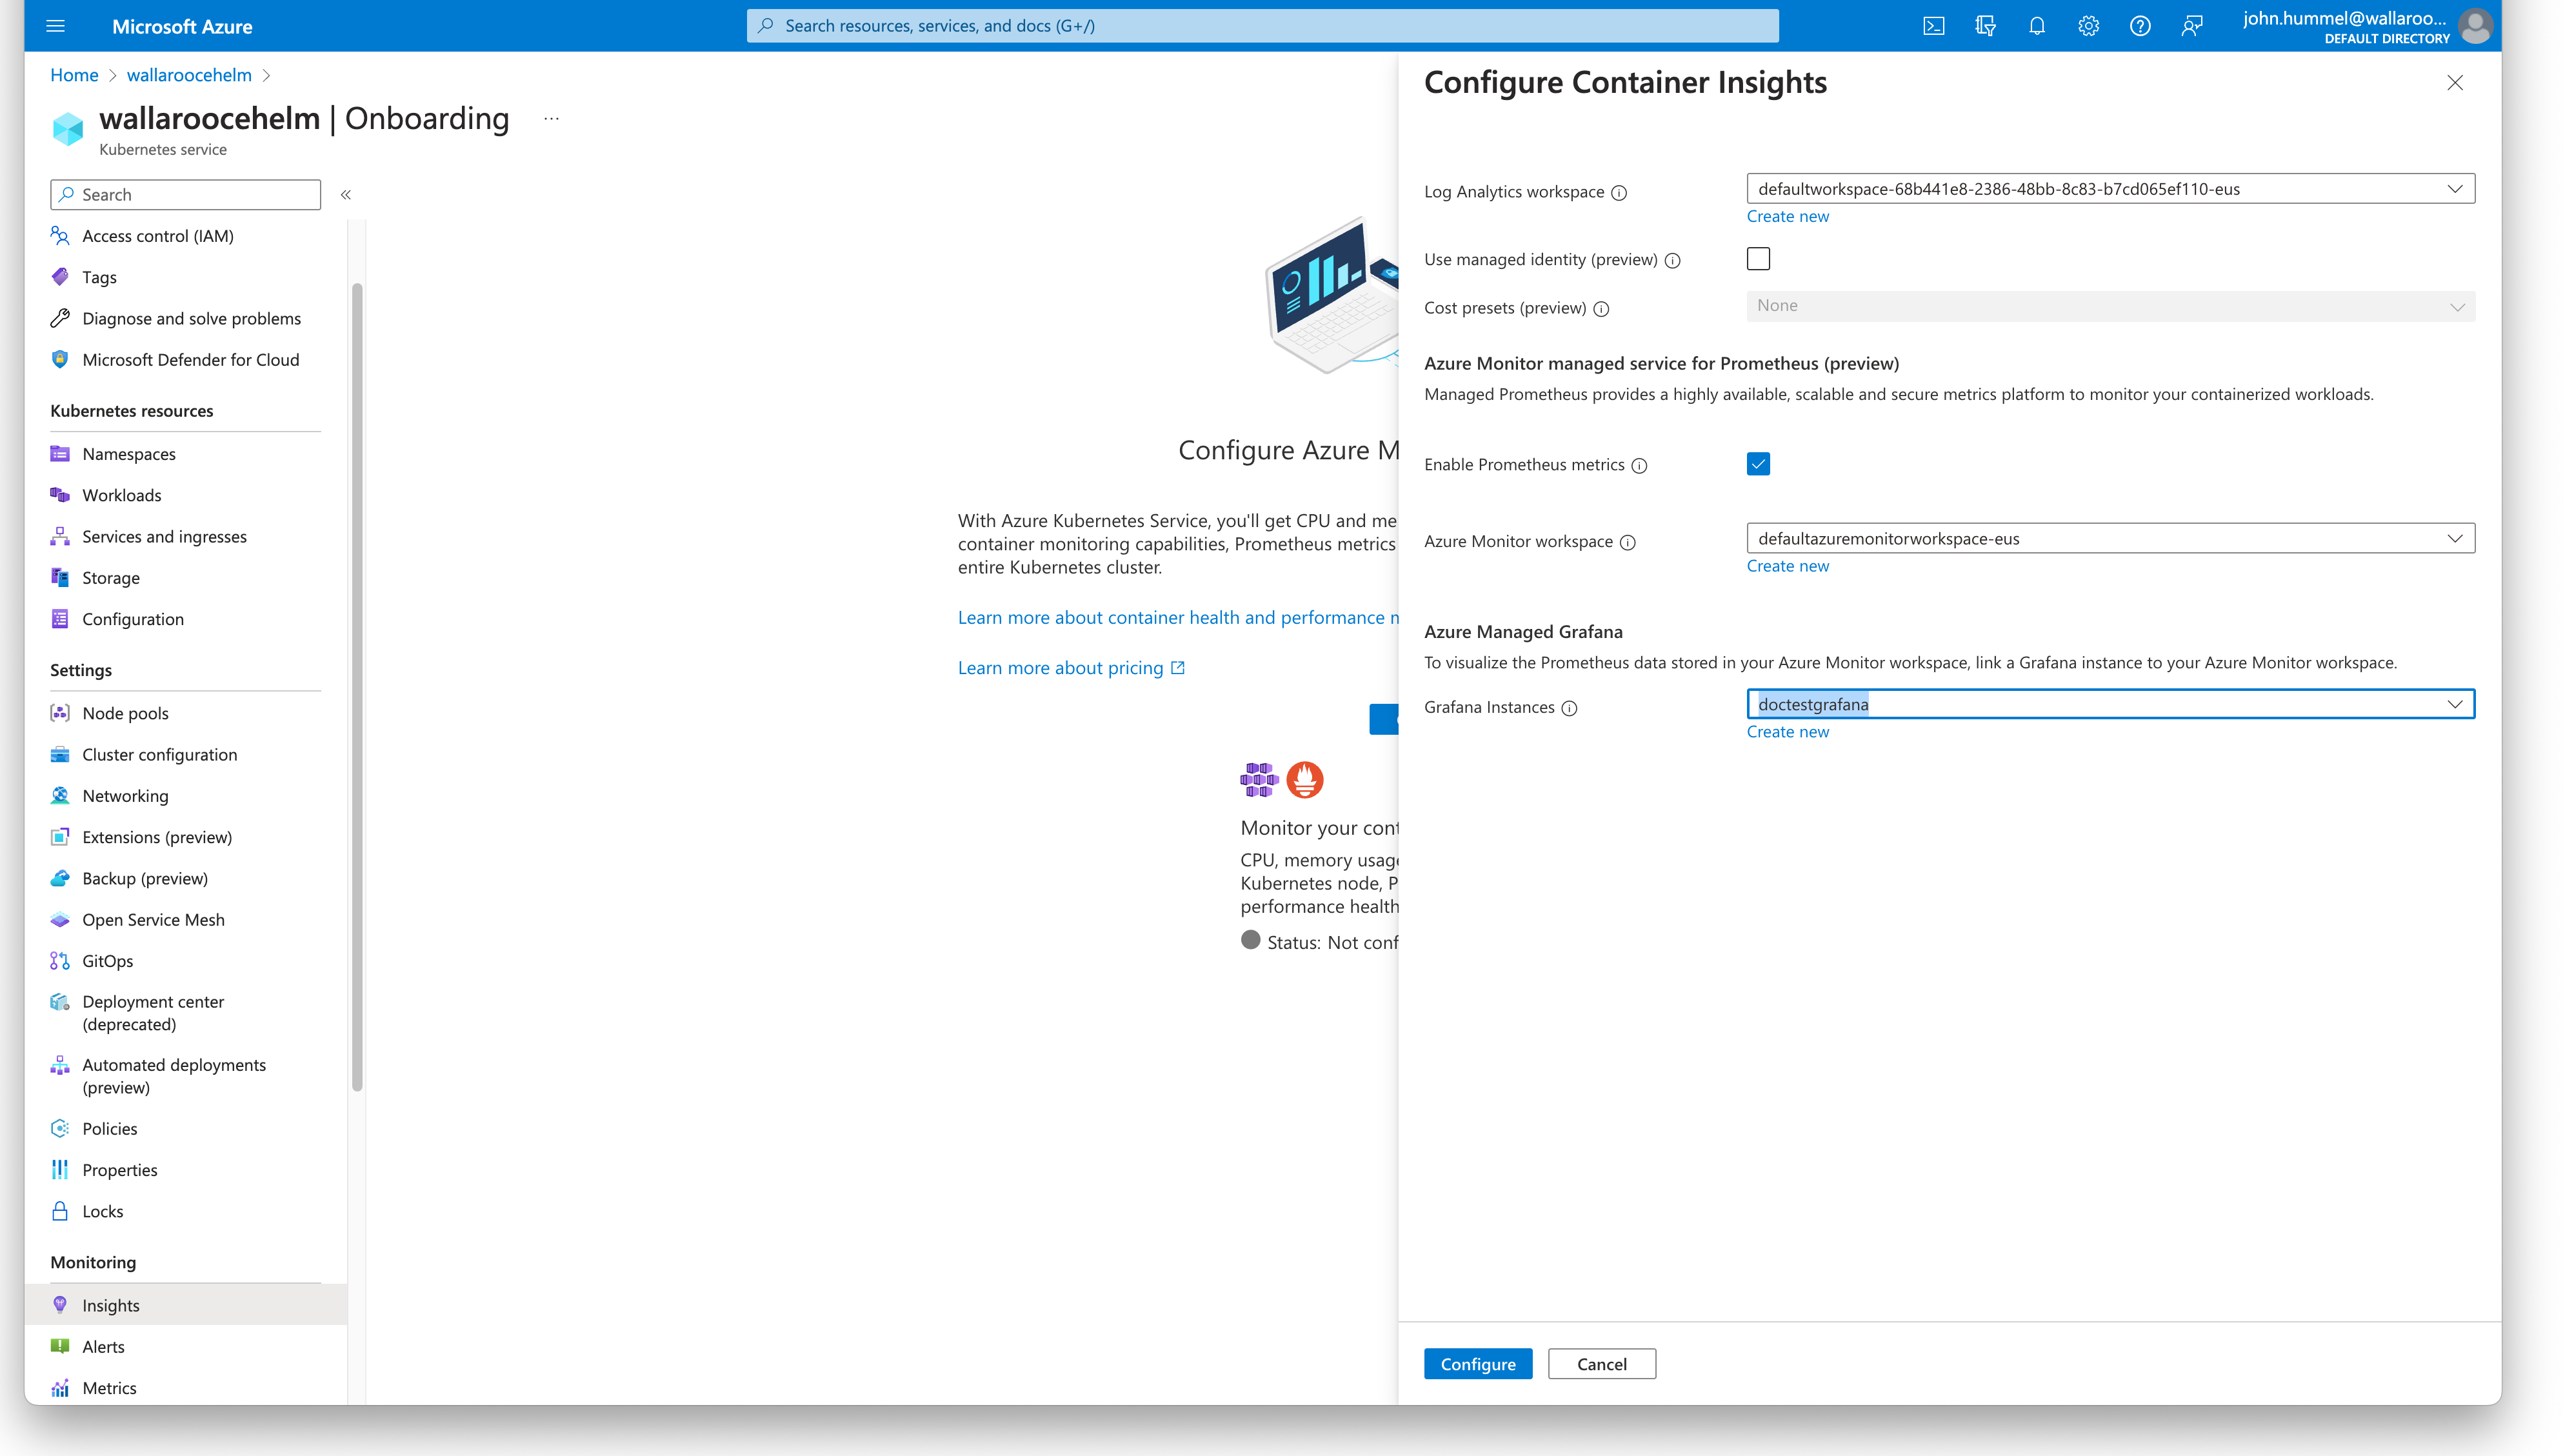
If Insights have not been configured before, select Configure.
Set the following:
- Enable Prometheus metrics: Enable.
- Azure Monitor workspace: Either select an existing Azure Monitor workspace, or create a new one.
- Azure Managed Grafana: Select the Grafana workspace to use with this cluster.
When complete, select Configure.
The onboarding process will take approximately 10-15 minutes.
Run Wallaroo Performance Results in Grafana
The following are two methods for accessing an Azure Kubernetes Cluster insights with Grafana.
Access Via the Azure Kubernetes Cluster
To access the Azure managed Grafana insights from a Kubernetes cluster:
Log into Microsoft Azure. From the Azure Services list, either select Kubernetes Services or search for
Kubernetes Servicesin the search bar.Select the cluster.
From the left navigation panel, select Insights.
Select View Grafana.
Select the Grafana instance.
From the Grafana instance, select Overview->Endpoint.
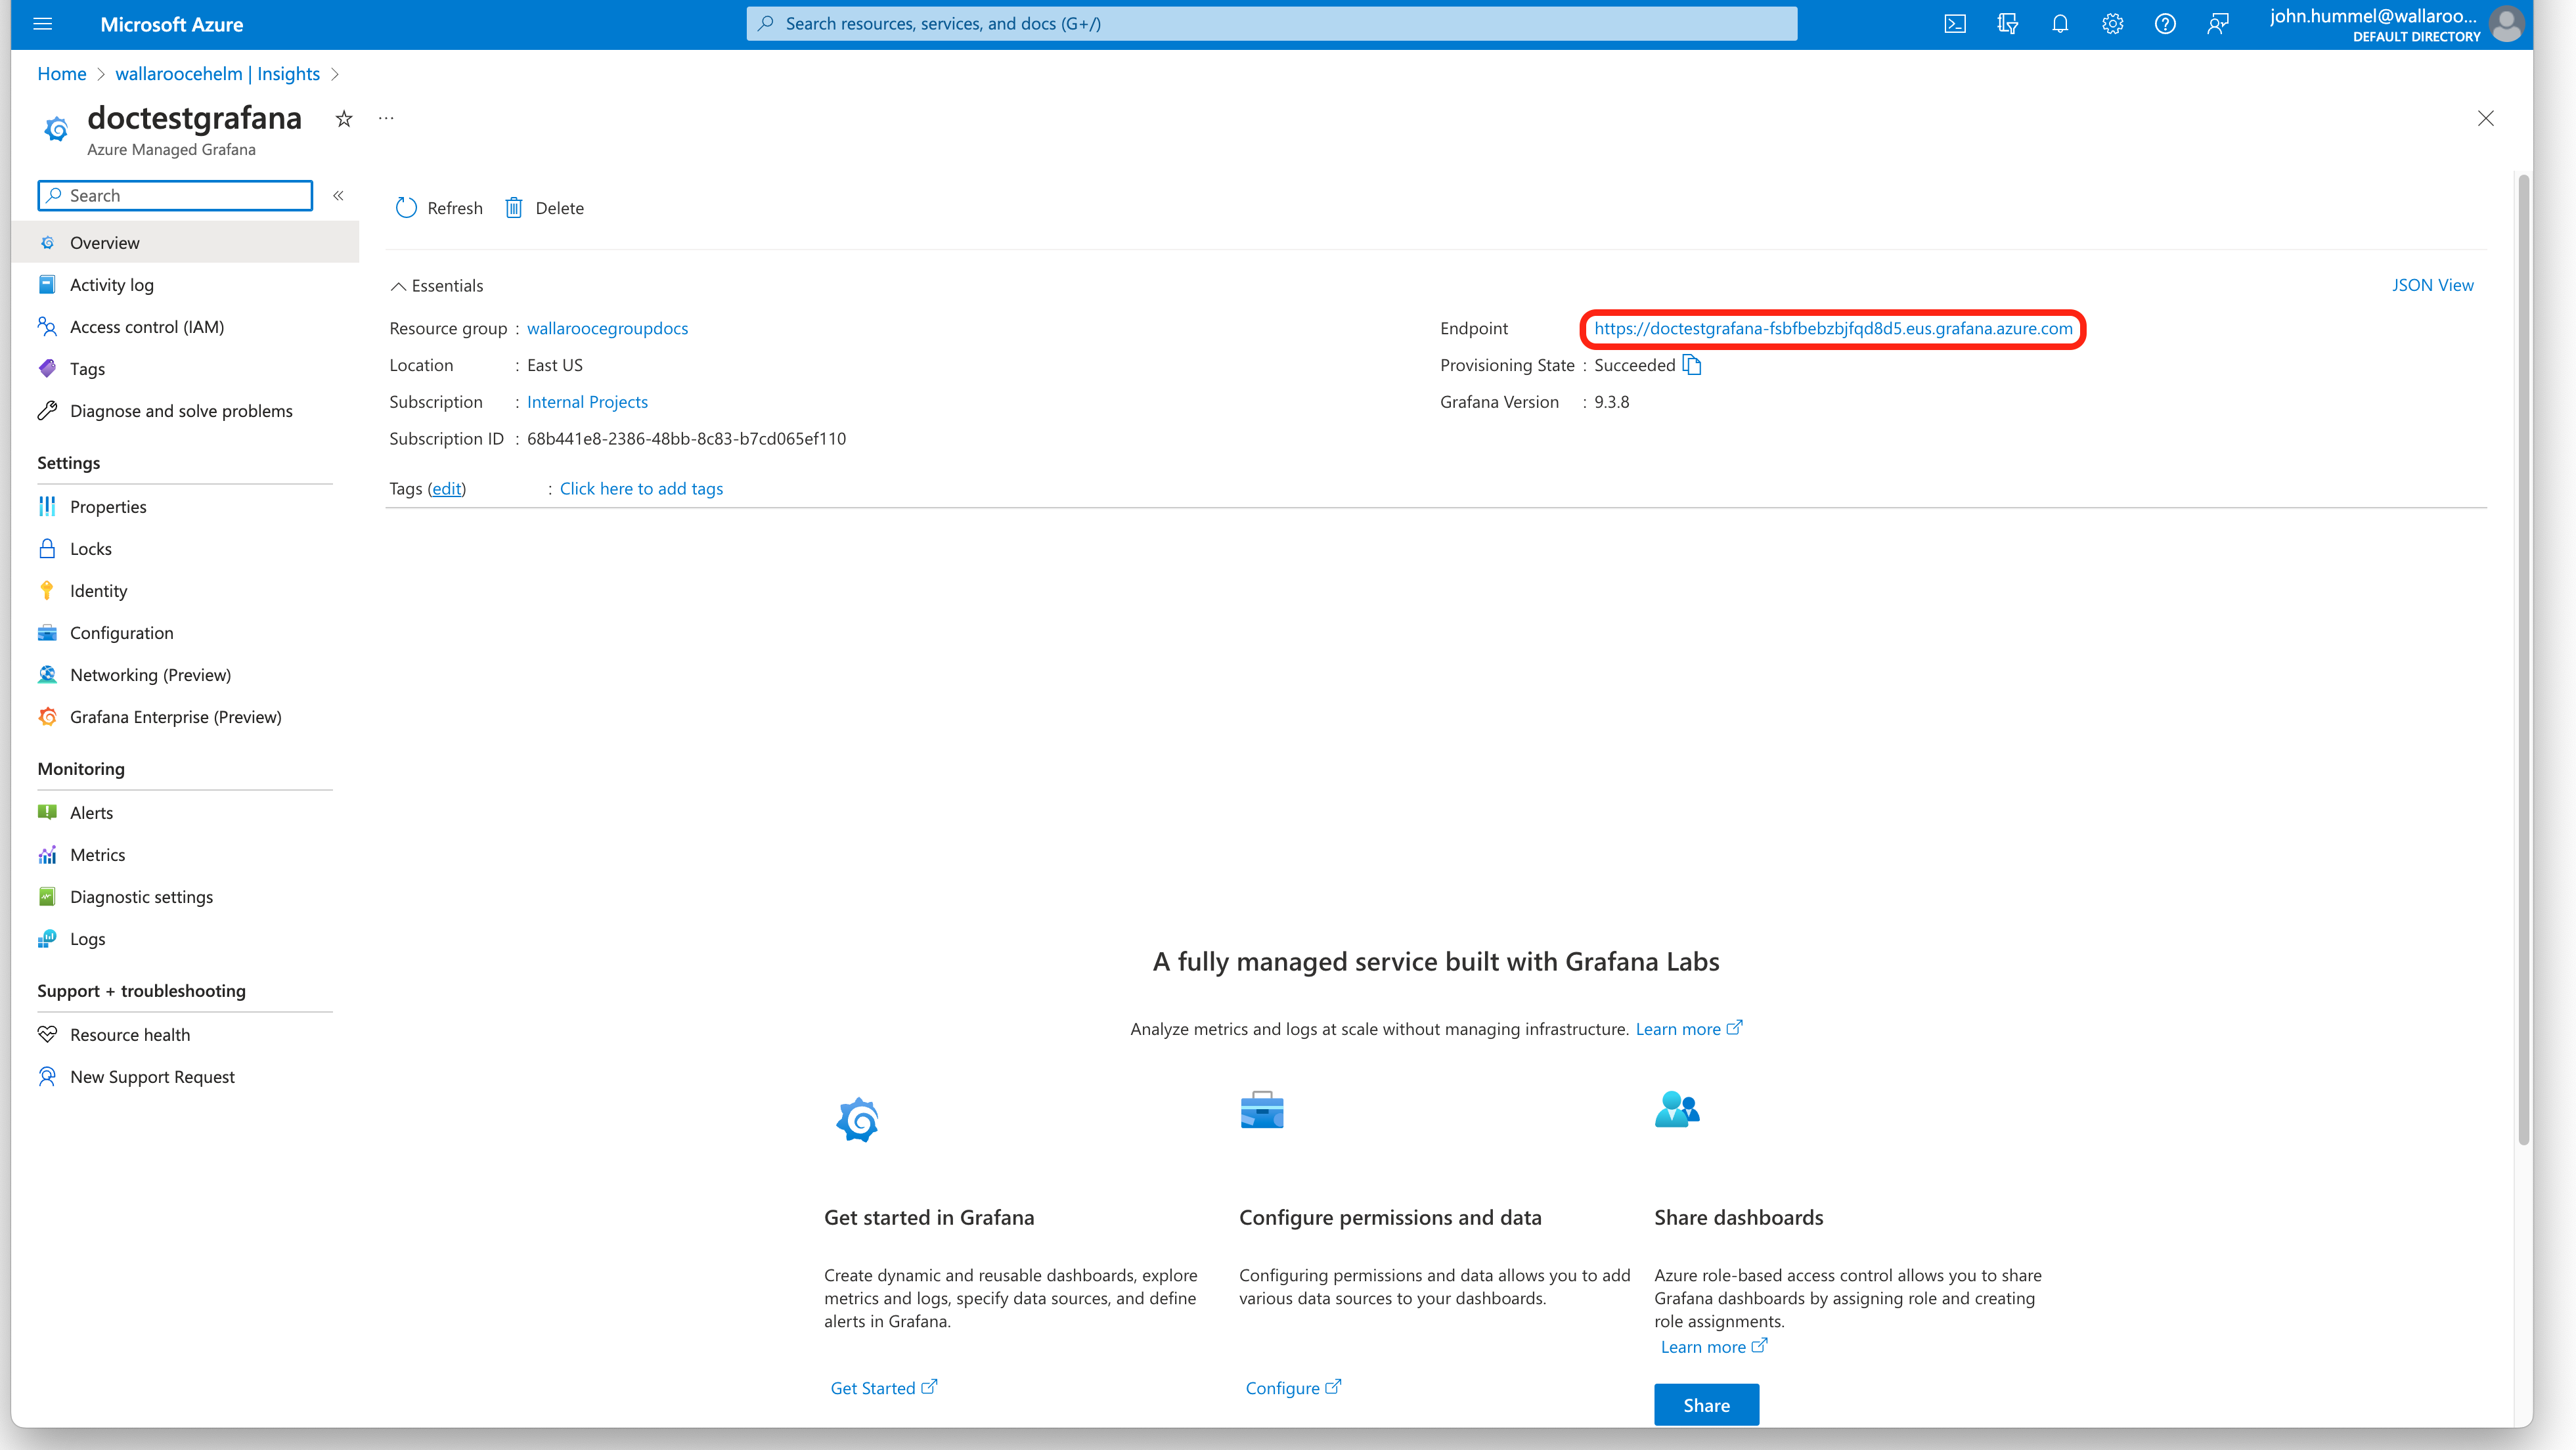
Access Via the Azure Managed Grafana Dashboard
To access the Azure managed Grafana insights for a cluster from the Azure Managed Grafana Dashboard:
- Log into Microsoft Azure. From the Azure Services list, either select Azure Managed Grafana or search for
Azure Managed Grafanain the search bar. - From the Azure Managed Grafana dashboard, select the Grafana instance.
- From the Grafana instance, select Overview->Endpoint.
Load Dashboards
Azure managed Grafana comes pre-packaged with several Dashboards. To view the available Dashboards, from the left navigation panel select Dashboards->Browser.
Recommended Dashboards
The following dashboards are recommended for checking on the performance of the overall Kubernetes cluster hosting the Wallaroo instance, and the performance of deployed Wallaroo pipelines. Each of the following are available in the Managed Prometheus folder.
Kubernetes Compute Resources Cluster
Displays the total load of the Kubernetes cluster. Select the Data Source, then the Cluster to monitor. From here, the CPU Usage, Memory Usage, Bandwidth, and other metrics can be viewed.
Kubernetes Compute Resources Namespace (Pods)
This dashboard breaks down the compute resources by Namespace. Deployed Wallaroo pipelines are associated with the Kubernetes namespace matching the format {WallarooPipelineName-WallarooPipelineID} the Wallaroo pipeline name. For example, the pipeline demandcurvepipeline with the the id 3 is associated with the namespace demandcurvepipeline-3.
Select the Data Source, Cluster, then the namespace to monitor. This dashboard can be useful to check if a pipeline requires more resources, or can be configured to use more or fewer resources to allocate more resources to other pipelines.
To drill down even further, select a pod. engine-lb pods are LoadBalancer pods, while engine pods represent the deployed model.
Manage Grafana Permissions
To allow other Azure users or groups access to the managed Grafana instance:
Log into Microsoft Azure. From the Azure Services list, either select Azure Managed Grafana or search for
Azure Managed Grafanain the search bar.From the Azure Managed Grafana dashboard, select the Grafana instance.
From the Grafana instance, select Overview->Access control (IAM).
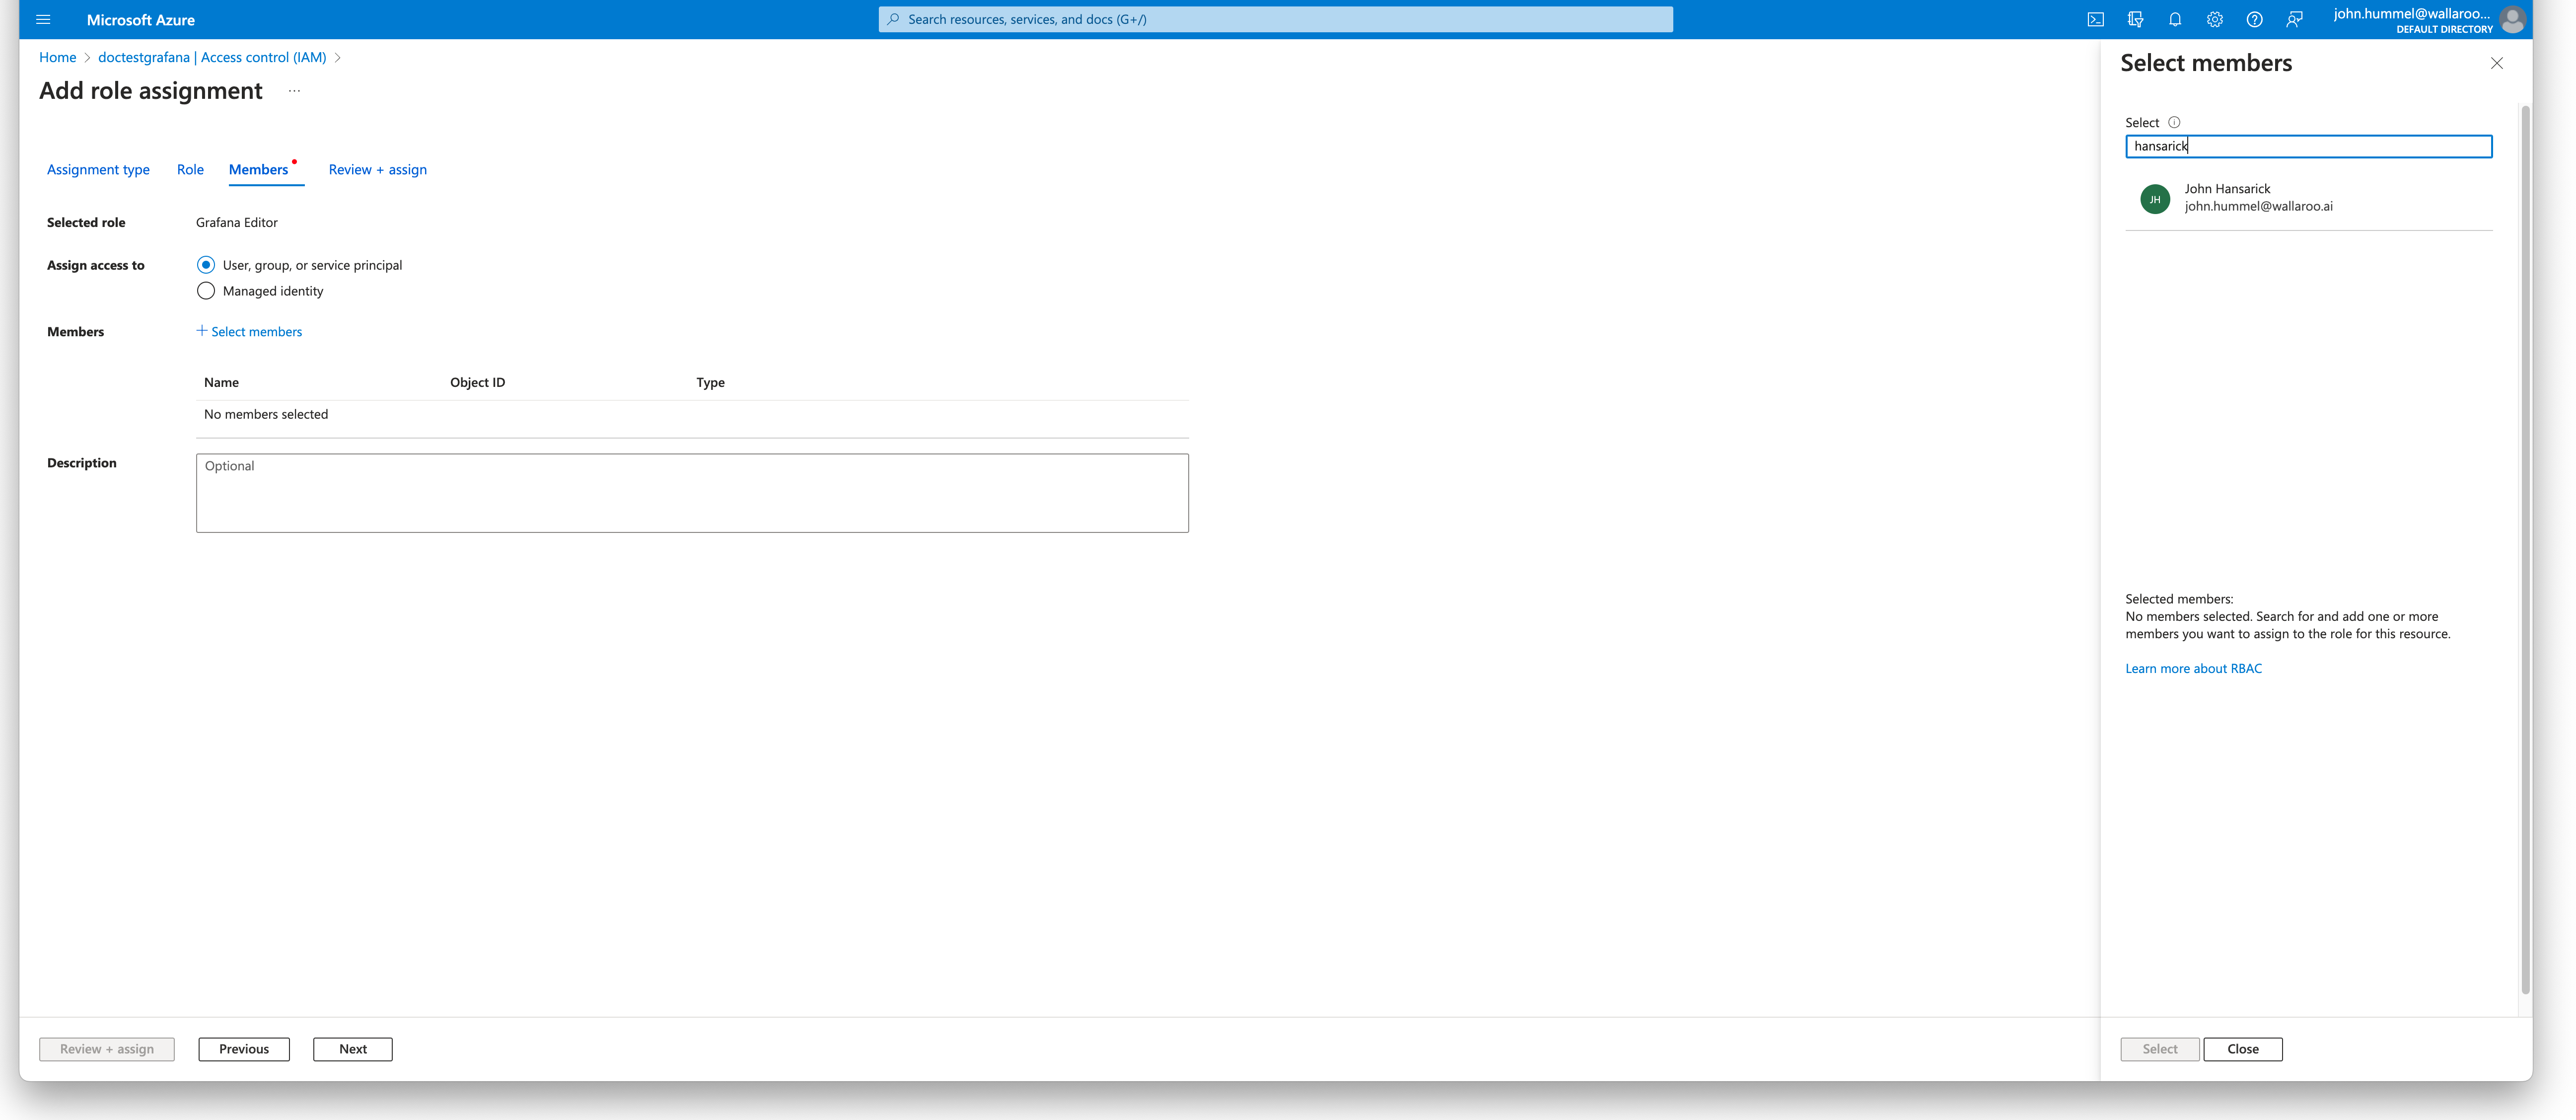
To add a new user or group access, select + Add->Add role assignment.
Select Job function roles, then select Next.
Select the role, then select Next.
Under Members, select +Select members and select from the user or group to assign to the Grafana role. Select Review + assign. Review the settings, then select Review + assign to save the settings.