The following guides instruct users on how to monitor Wallaroo’s performance, retrieve logs, and other monitoring tasks.
Wallaroo Monitoring Management
How to manage your Wallaroo performance.
- 1: Integrate Azure Kubernetes Wallaroo Cluster with Azure Managed Grafana
- 2: Monitor Wallaroo Pipeline Logs through Kubernetes
1 - Integrate Azure Kubernetes Wallaroo Cluster with Azure Managed Grafana
How to integrate Azure Grafana to an Azure Kubernetes based installation of Wallaroo
Organizations that have installed Wallaroo using Microsoft Azure can integrate Azure Managed Grafana. This allows reports to be created tracking the performance of Wallaroo pipelines, overall cluster health, and other vital performance data benchmarks.
Create Azure Managed Grafana Workspace
To create a new Azure Managed Grafana Workspace:
Log into Microsoft Azure. From the Azure Services list, either select Azure Managed Grafana or search for
Azure Managed Grafanain the search bar.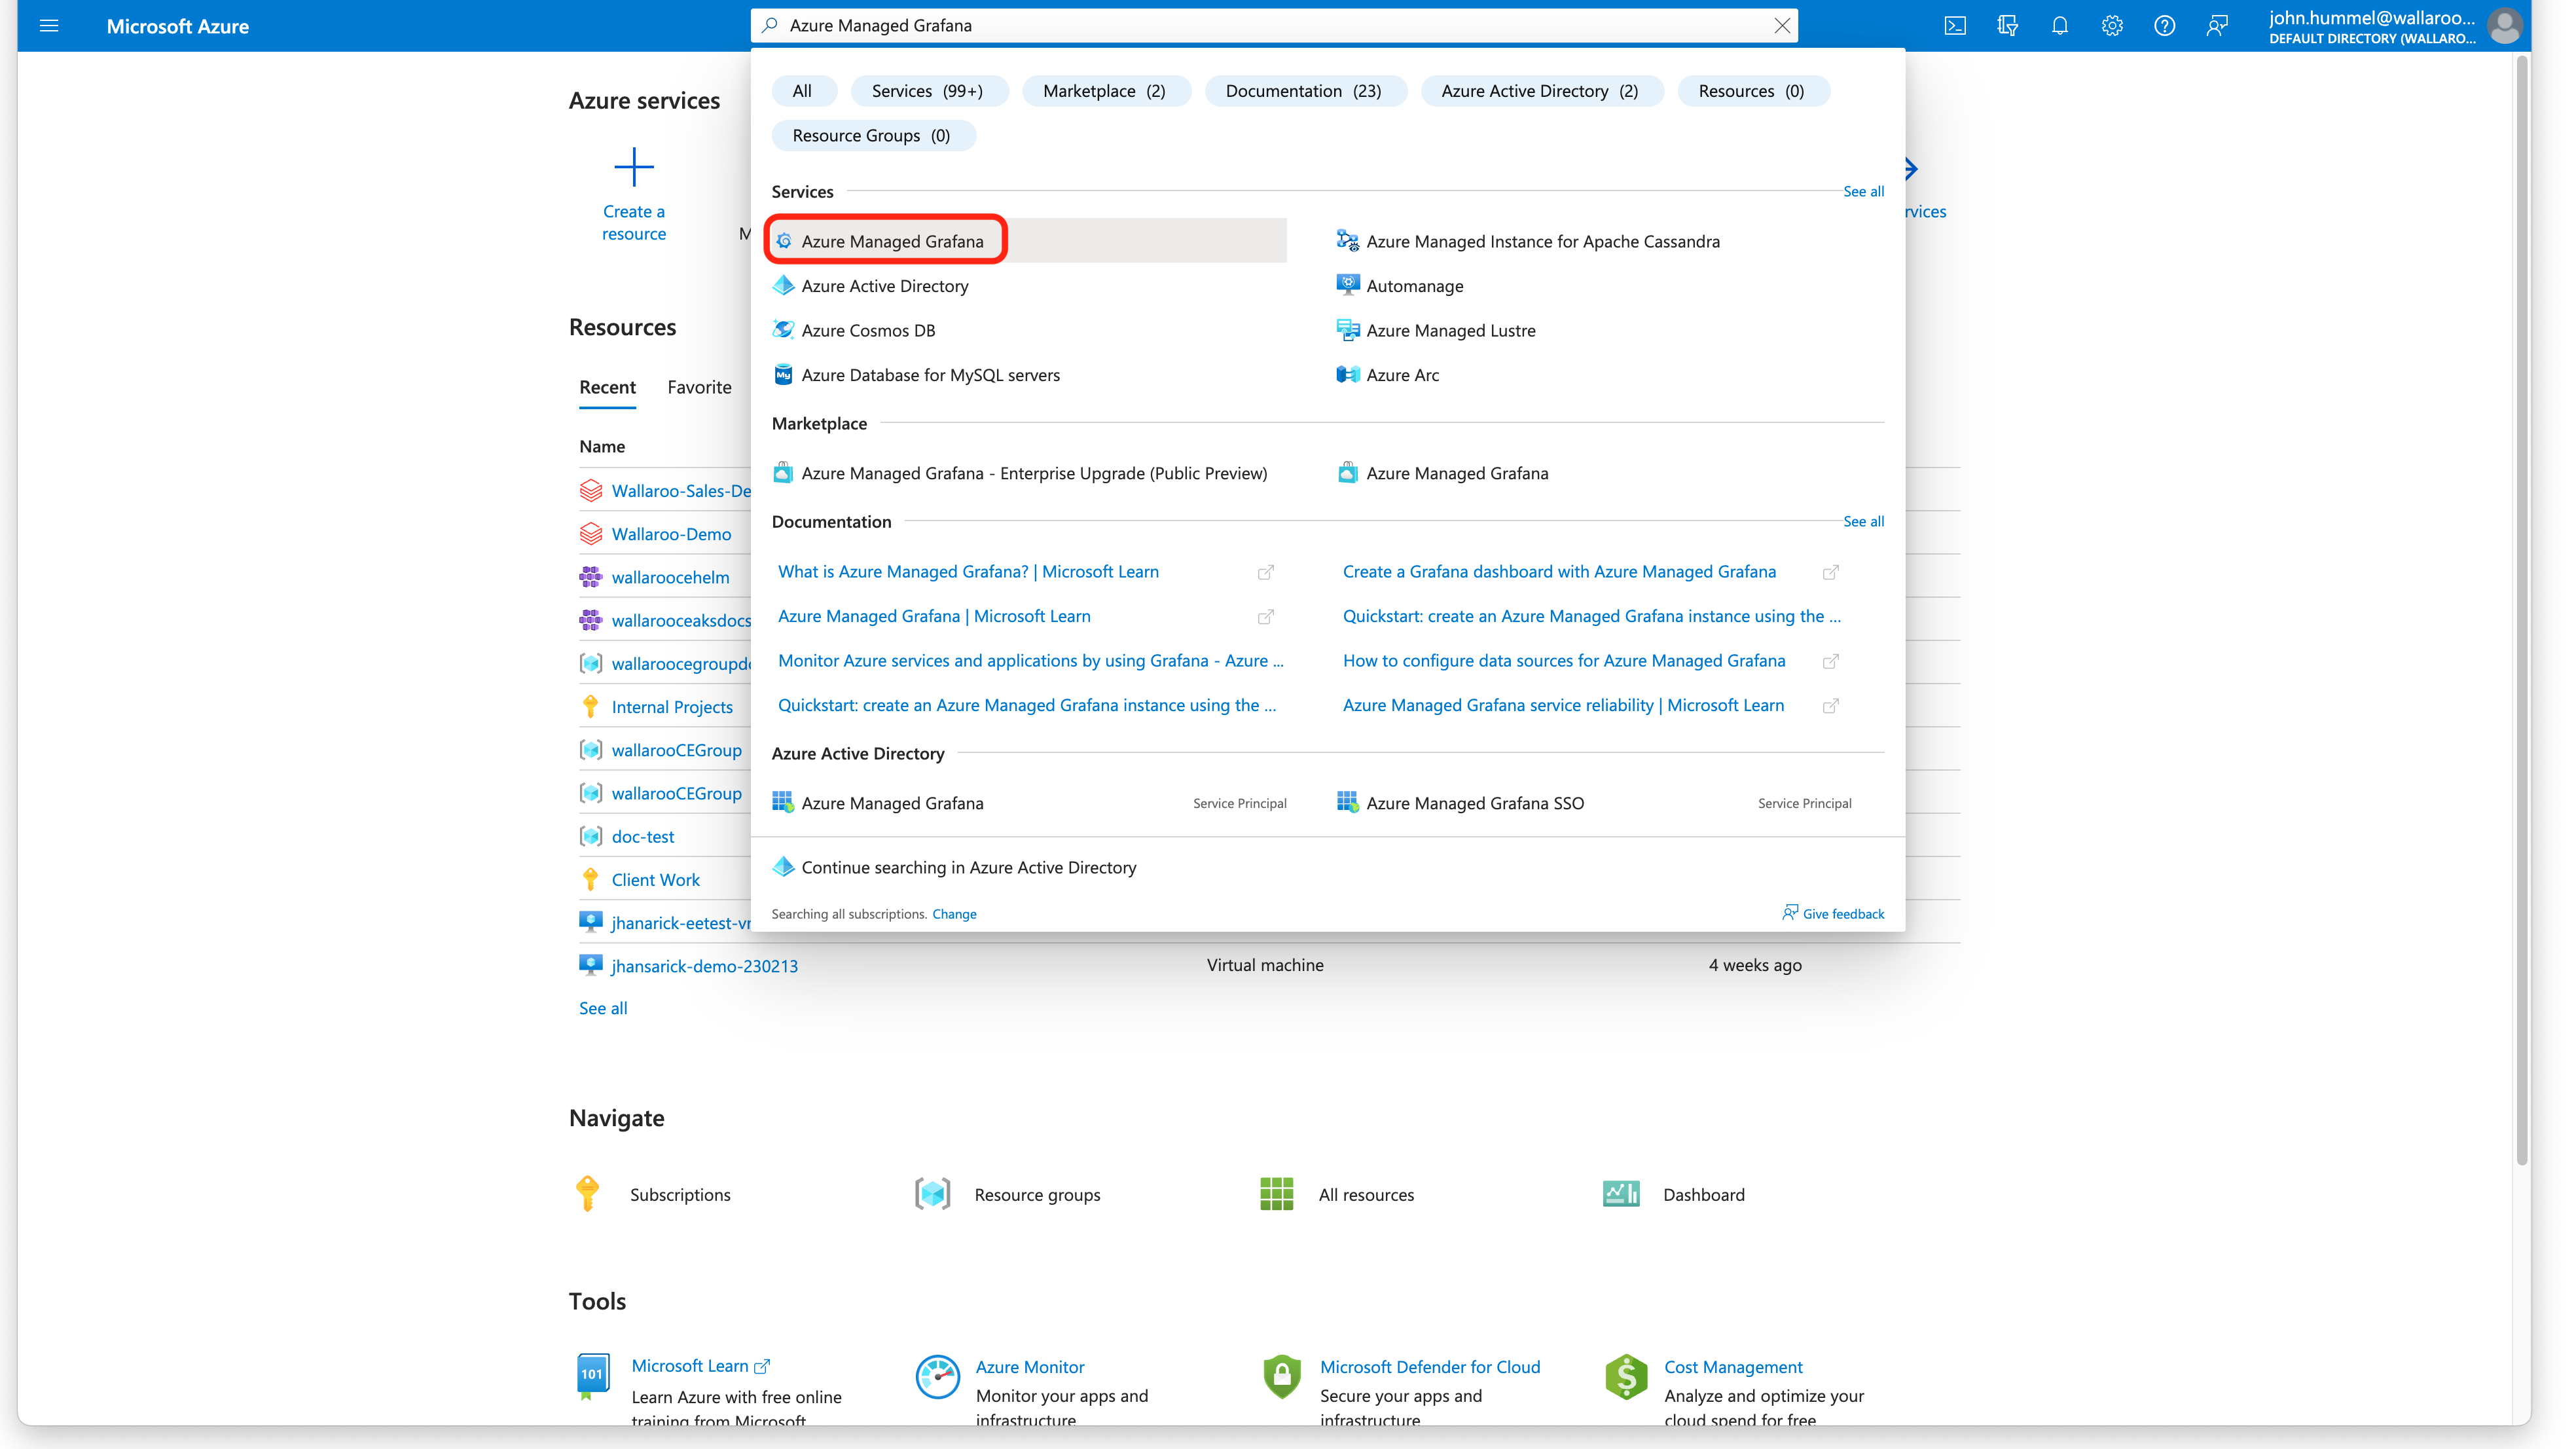
From the Azure Managed Grafana dashboard, select +Create.
Set the following minimum settings. Any other settings are up to the organization’s requirements.
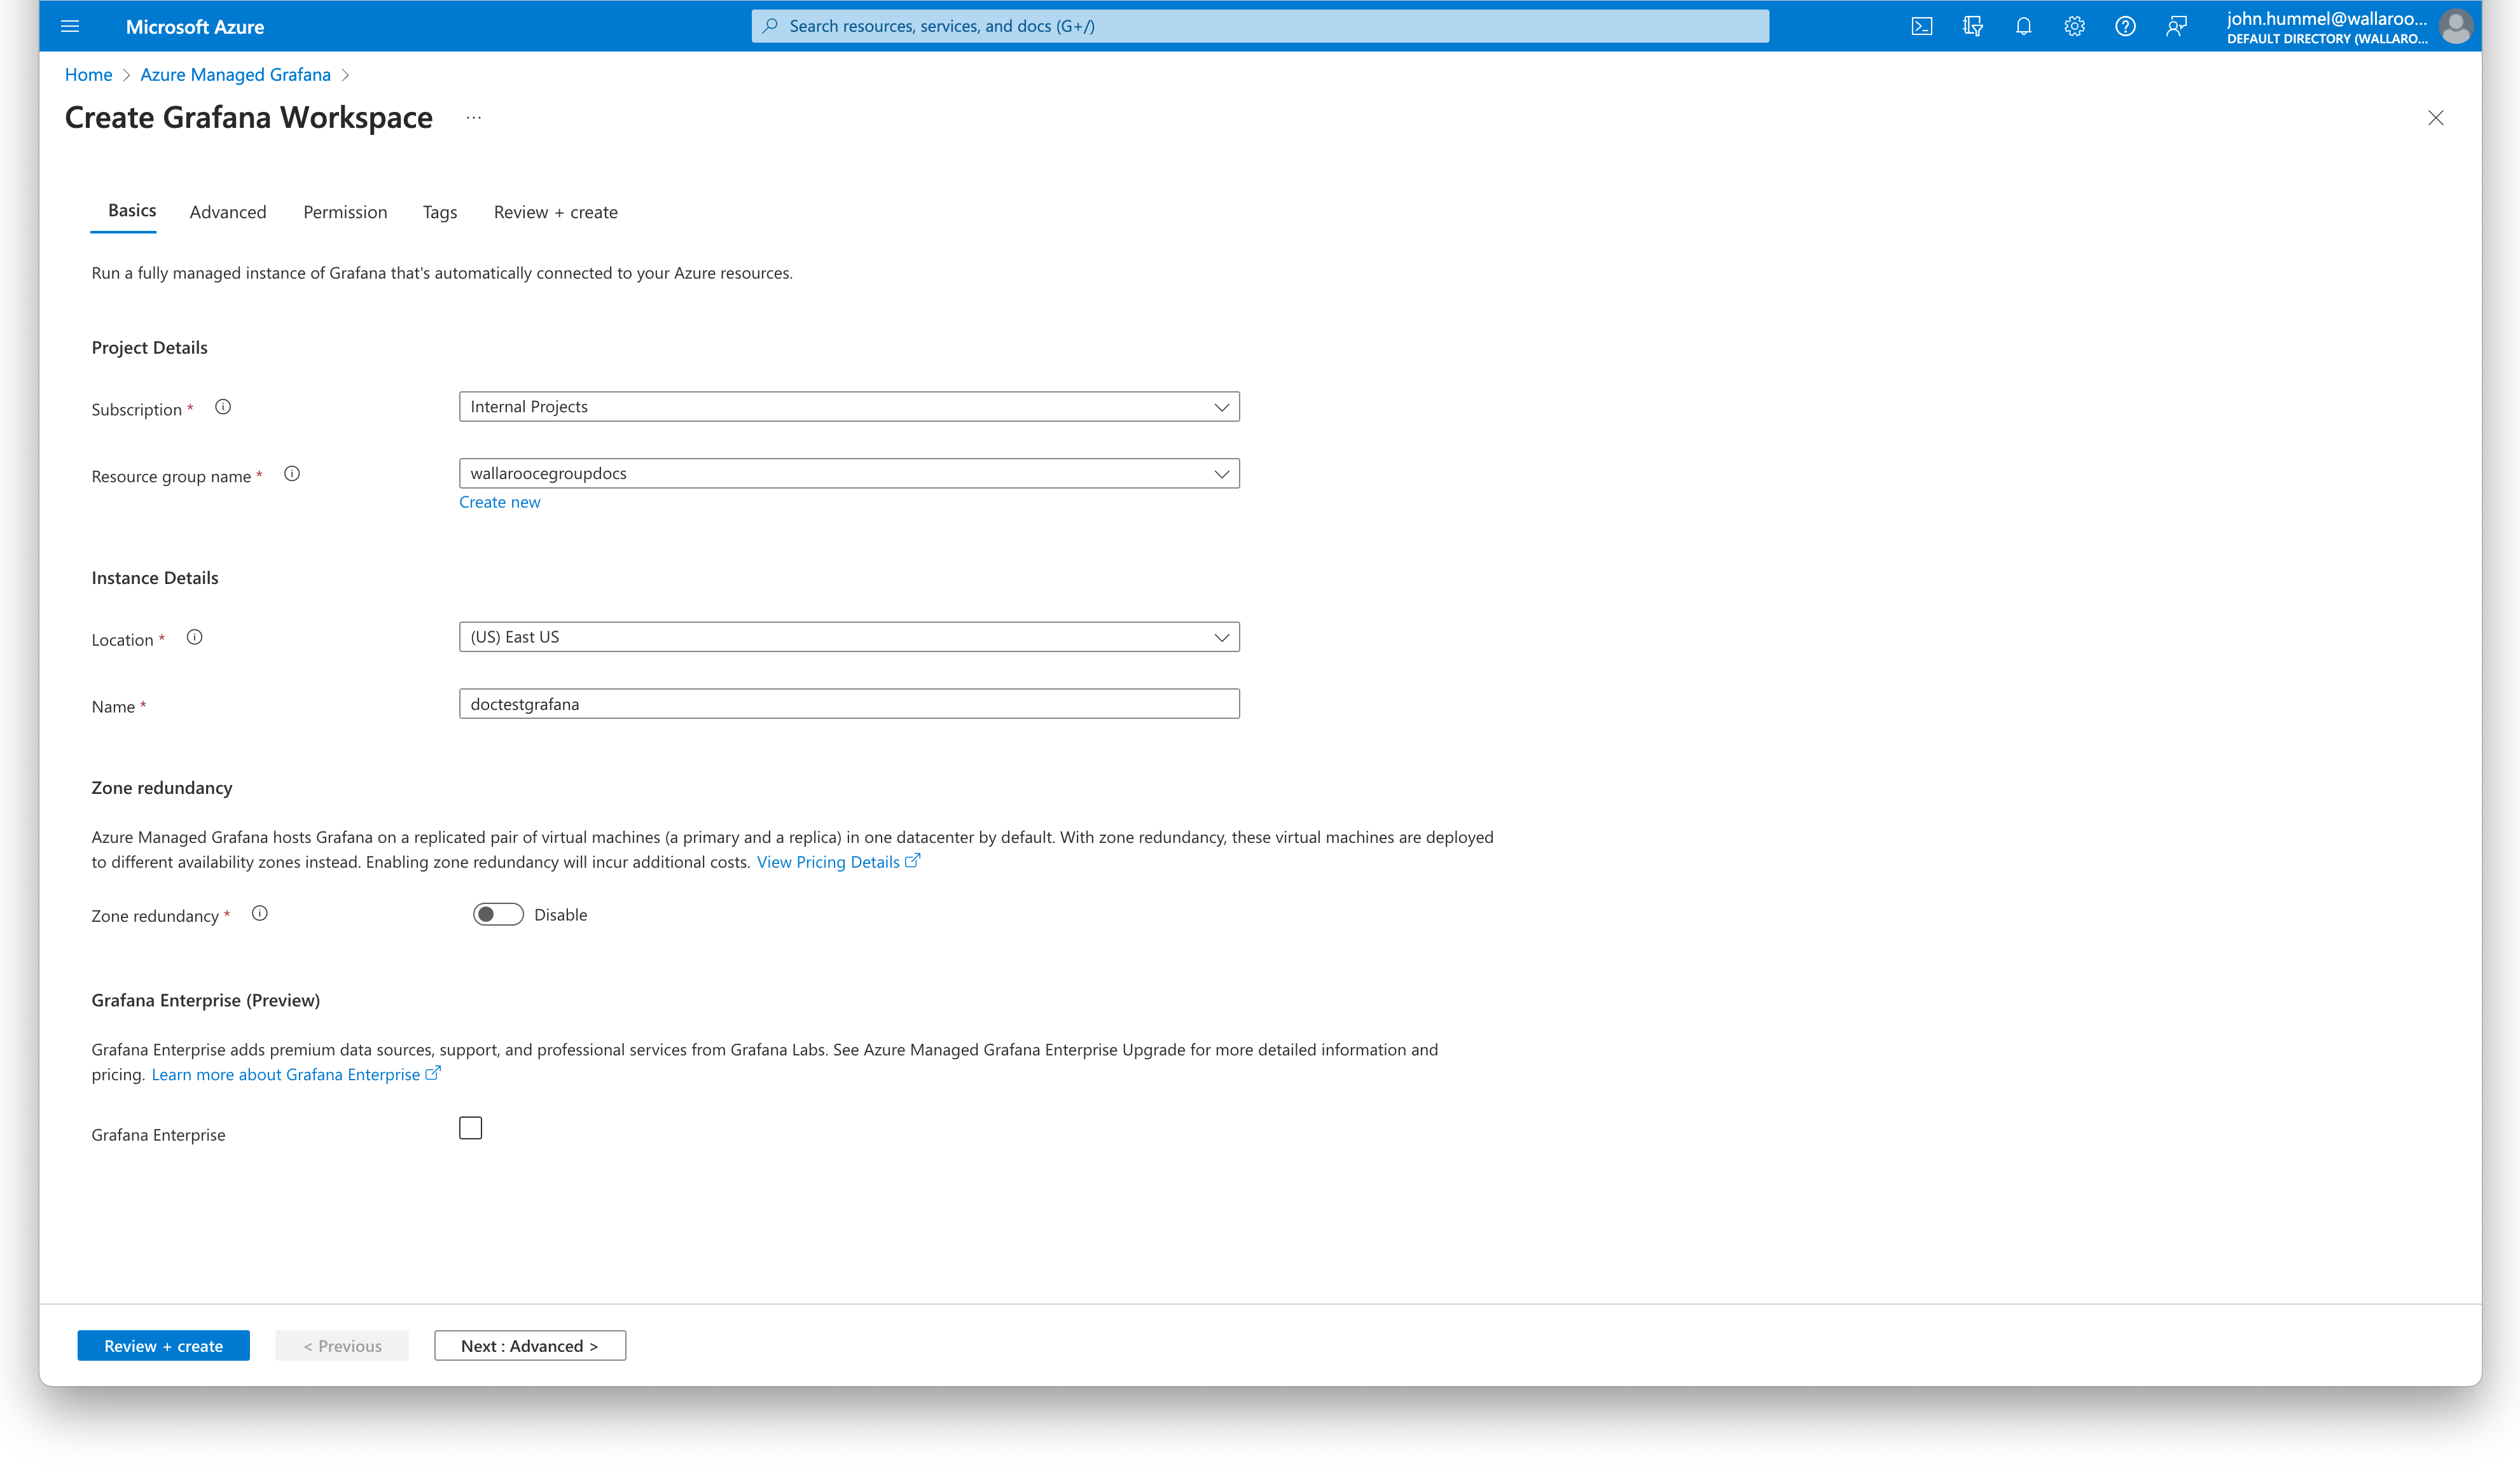
- Subscription: The subscription used for billing the Grafana workspace.
- Resource Group Name: Select from an existing or use Create new to create a new Azure Resource Group for managing permissions to the Grafana workspace.
- Instance Details
- Location: Where the Grafana workspace is hosted. It is recommended it be in the same location as the Kubernetes cluster hosting the Wallaroo instance.
- Name: The name of the Grafana workspace.
Select Review + create when finished. Review the settings, then select Create to complete the process.
Add Azure Managed Grafana Workspace to Microsoft Azure Kubernetes Cluster
To integrate an Azure Managed Grafana Workspace to a Microsoft Azure Kubernetes cluster for monitoring:
Log into Microsoft Azure. From the Azure Services list, either select Kubernetes Services or search for
Kubernetes Servicesin the search bar.From the Kubernetes services dashboard, select the cluster to monitor.
From the cluster dashboard, from the left navigation panel select Monitoring->Insights.
If Insights have not been configured before, select Configure.
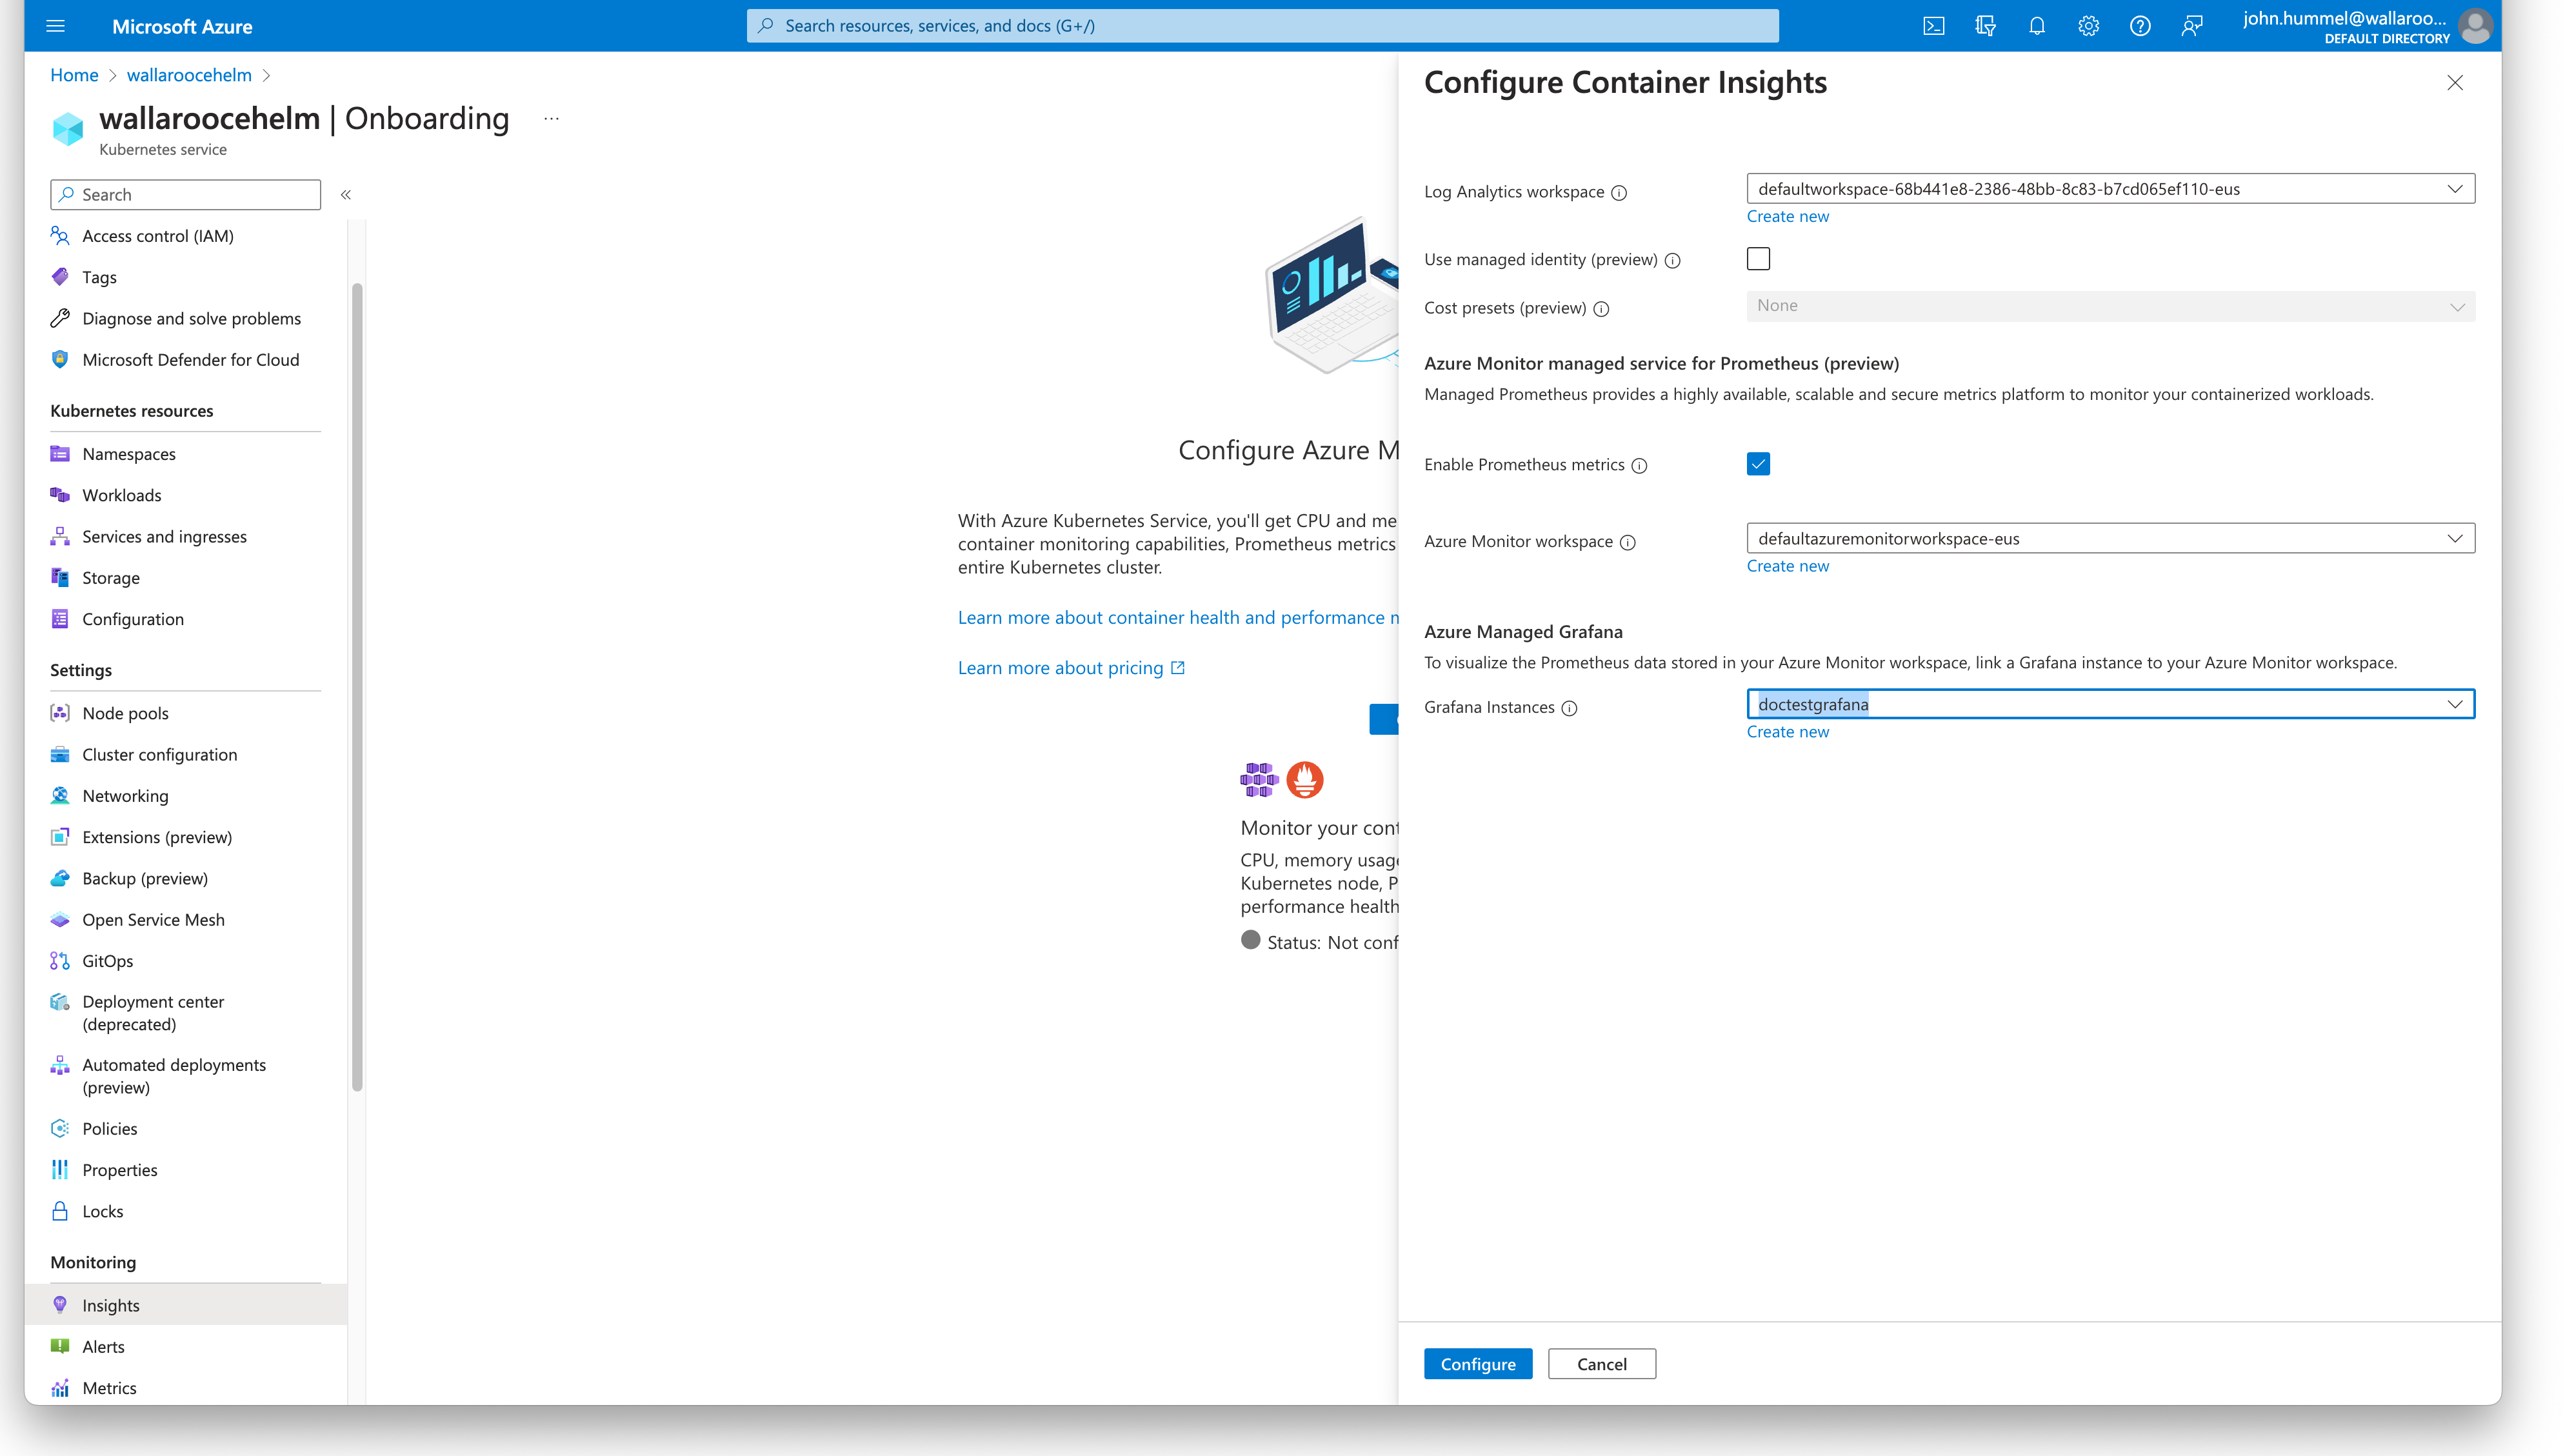
Set the following:
- Enable Prometheus metrics: Enable.
- Azure Monitor workspace: Either select an existing Azure Monitor workspace, or create a new one.
- Azure Managed Grafana: Select the Grafana workspace to use with this cluster.
When complete, select Configure.
The onboarding process will take approximately 10-15 minutes.
Run Wallaroo Performance Results in Grafana
The following are two methods for accessing an Azure Kubernetes Cluster insights with Grafana.
Access Via the Azure Kubernetes Cluster
To access the Azure managed Grafana insights from a Kubernetes cluster:
Log into Microsoft Azure. From the Azure Services list, either select Kubernetes Services or search for
Kubernetes Servicesin the search bar.Select the cluster.
From the left navigation panel, select Insights.
Select View Grafana.
Select the Grafana instance.
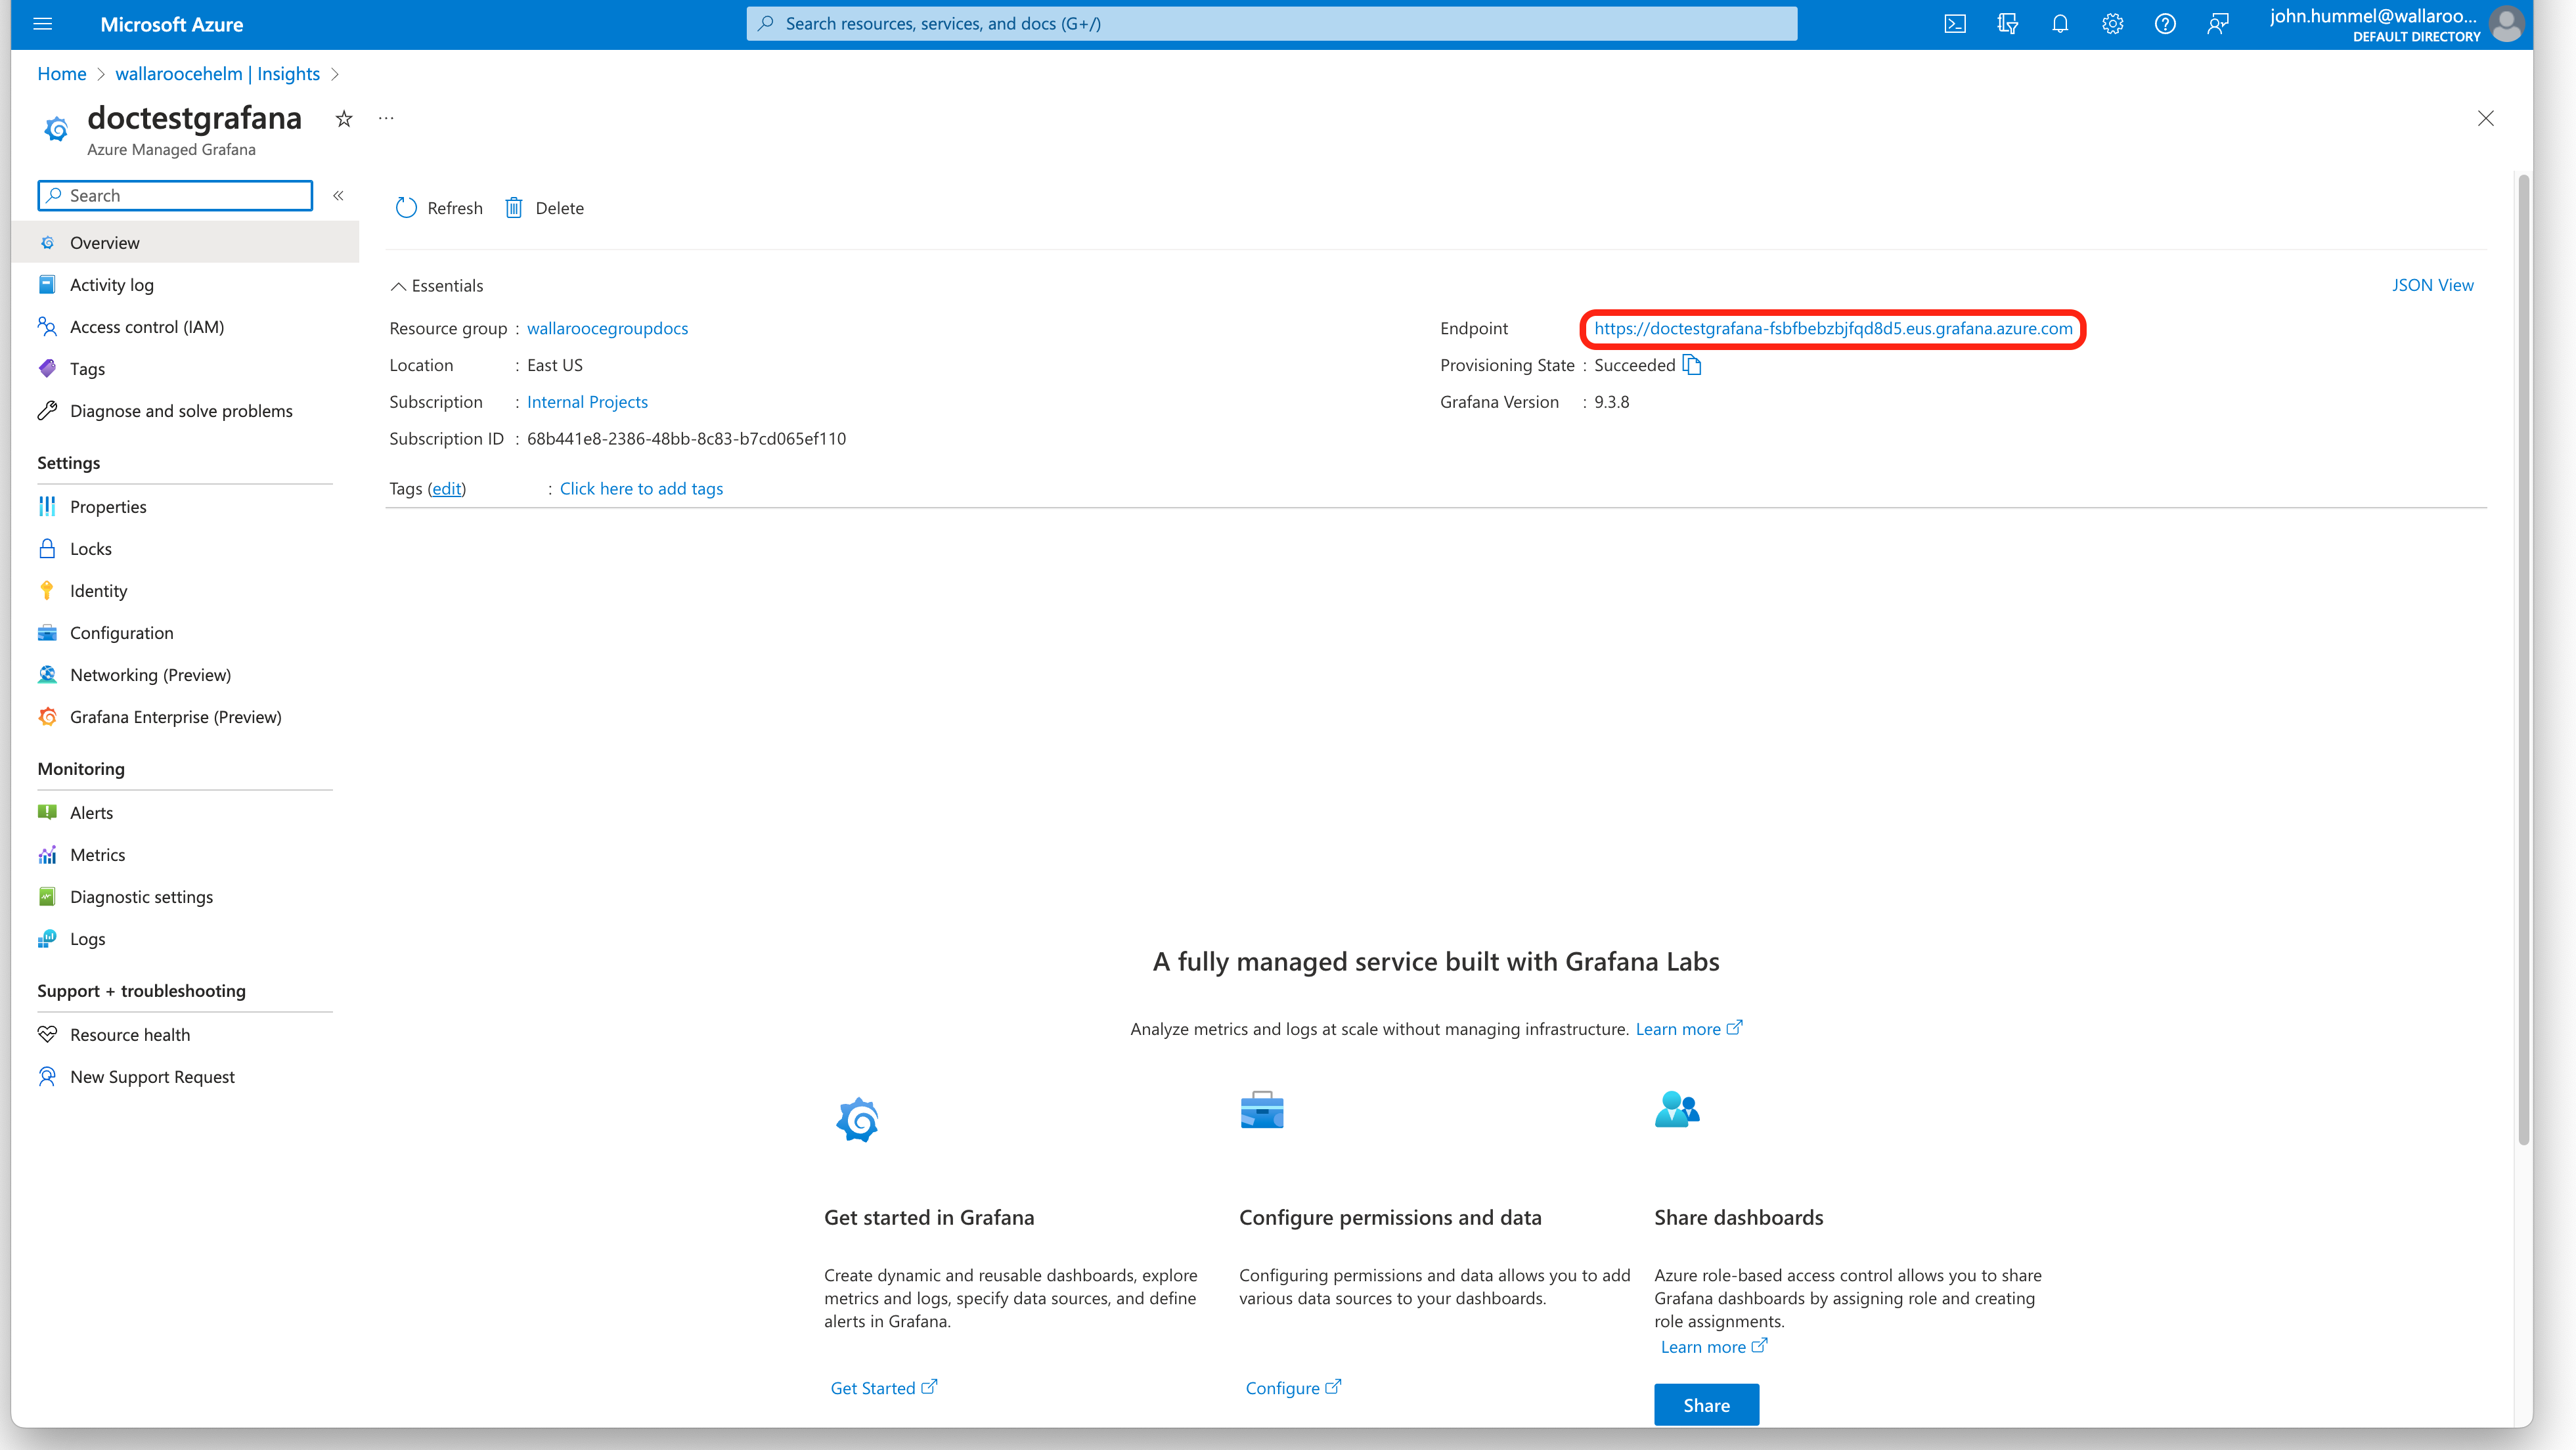
From the Grafana instance, select Overview->Endpoint.
Access Via the Azure Managed Grafana Dashboard
To access the Azure managed Grafana insights for a cluster from the Azure Managed Grafana Dashboard:
- Log into Microsoft Azure. From the Azure Services list, either select Azure Managed Grafana or search for
Azure Managed Grafanain the search bar. - From the Azure Managed Grafana dashboard, select the Grafana instance.
- From the Grafana instance, select Overview->Endpoint.
Load Dashboards
Azure managed Grafana comes pre-packaged with several Dashboards. To view the available Dashboards, from the left navigation panel select Dashboards->Browser.
Recommended Dashboards
The following dashboards are recommended for checking on the performance of the overall Kubernetes cluster hosting the Wallaroo instance, and the performance of deployed Wallaroo pipelines. Each of the following are available in the Managed Prometheus folder.
Kubernetes Compute Resources Cluster
Displays the total load of the Kubernetes cluster. Select the Data Source, then the Cluster to monitor. From here, the CPU Usage, Memory Usage, Bandwidth, and other metrics can be viewed.
Kubernetes Compute Resources Namespace (Pods)
This dashboard breaks down the compute resources by Namespace. Deployed Wallaroo pipelines are associated with the Kubernetes namespace matching the format {WallarooPipelineName-WallarooPipelineID} the Wallaroo pipeline name. For example, the pipeline demandcurvepipeline with the the id 3 is associated with the namespace demandcurvepipeline-3.
Select the Data Source, Cluster, then the namespace to monitor. This dashboard can be useful to check if a pipeline requires more resources, or can be configured to use more or fewer resources to allocate more resources to other pipelines.
To drill down even further, select a pod. engine-lb pods are LoadBalancer pods, while engine pods represent the deployed model.
Manage Grafana Permissions
To allow other Azure users or groups access to the managed Grafana instance:
Log into Microsoft Azure. From the Azure Services list, either select Azure Managed Grafana or search for
Azure Managed Grafanain the search bar.From the Azure Managed Grafana dashboard, select the Grafana instance.
From the Grafana instance, select Overview->Access control (IAM).
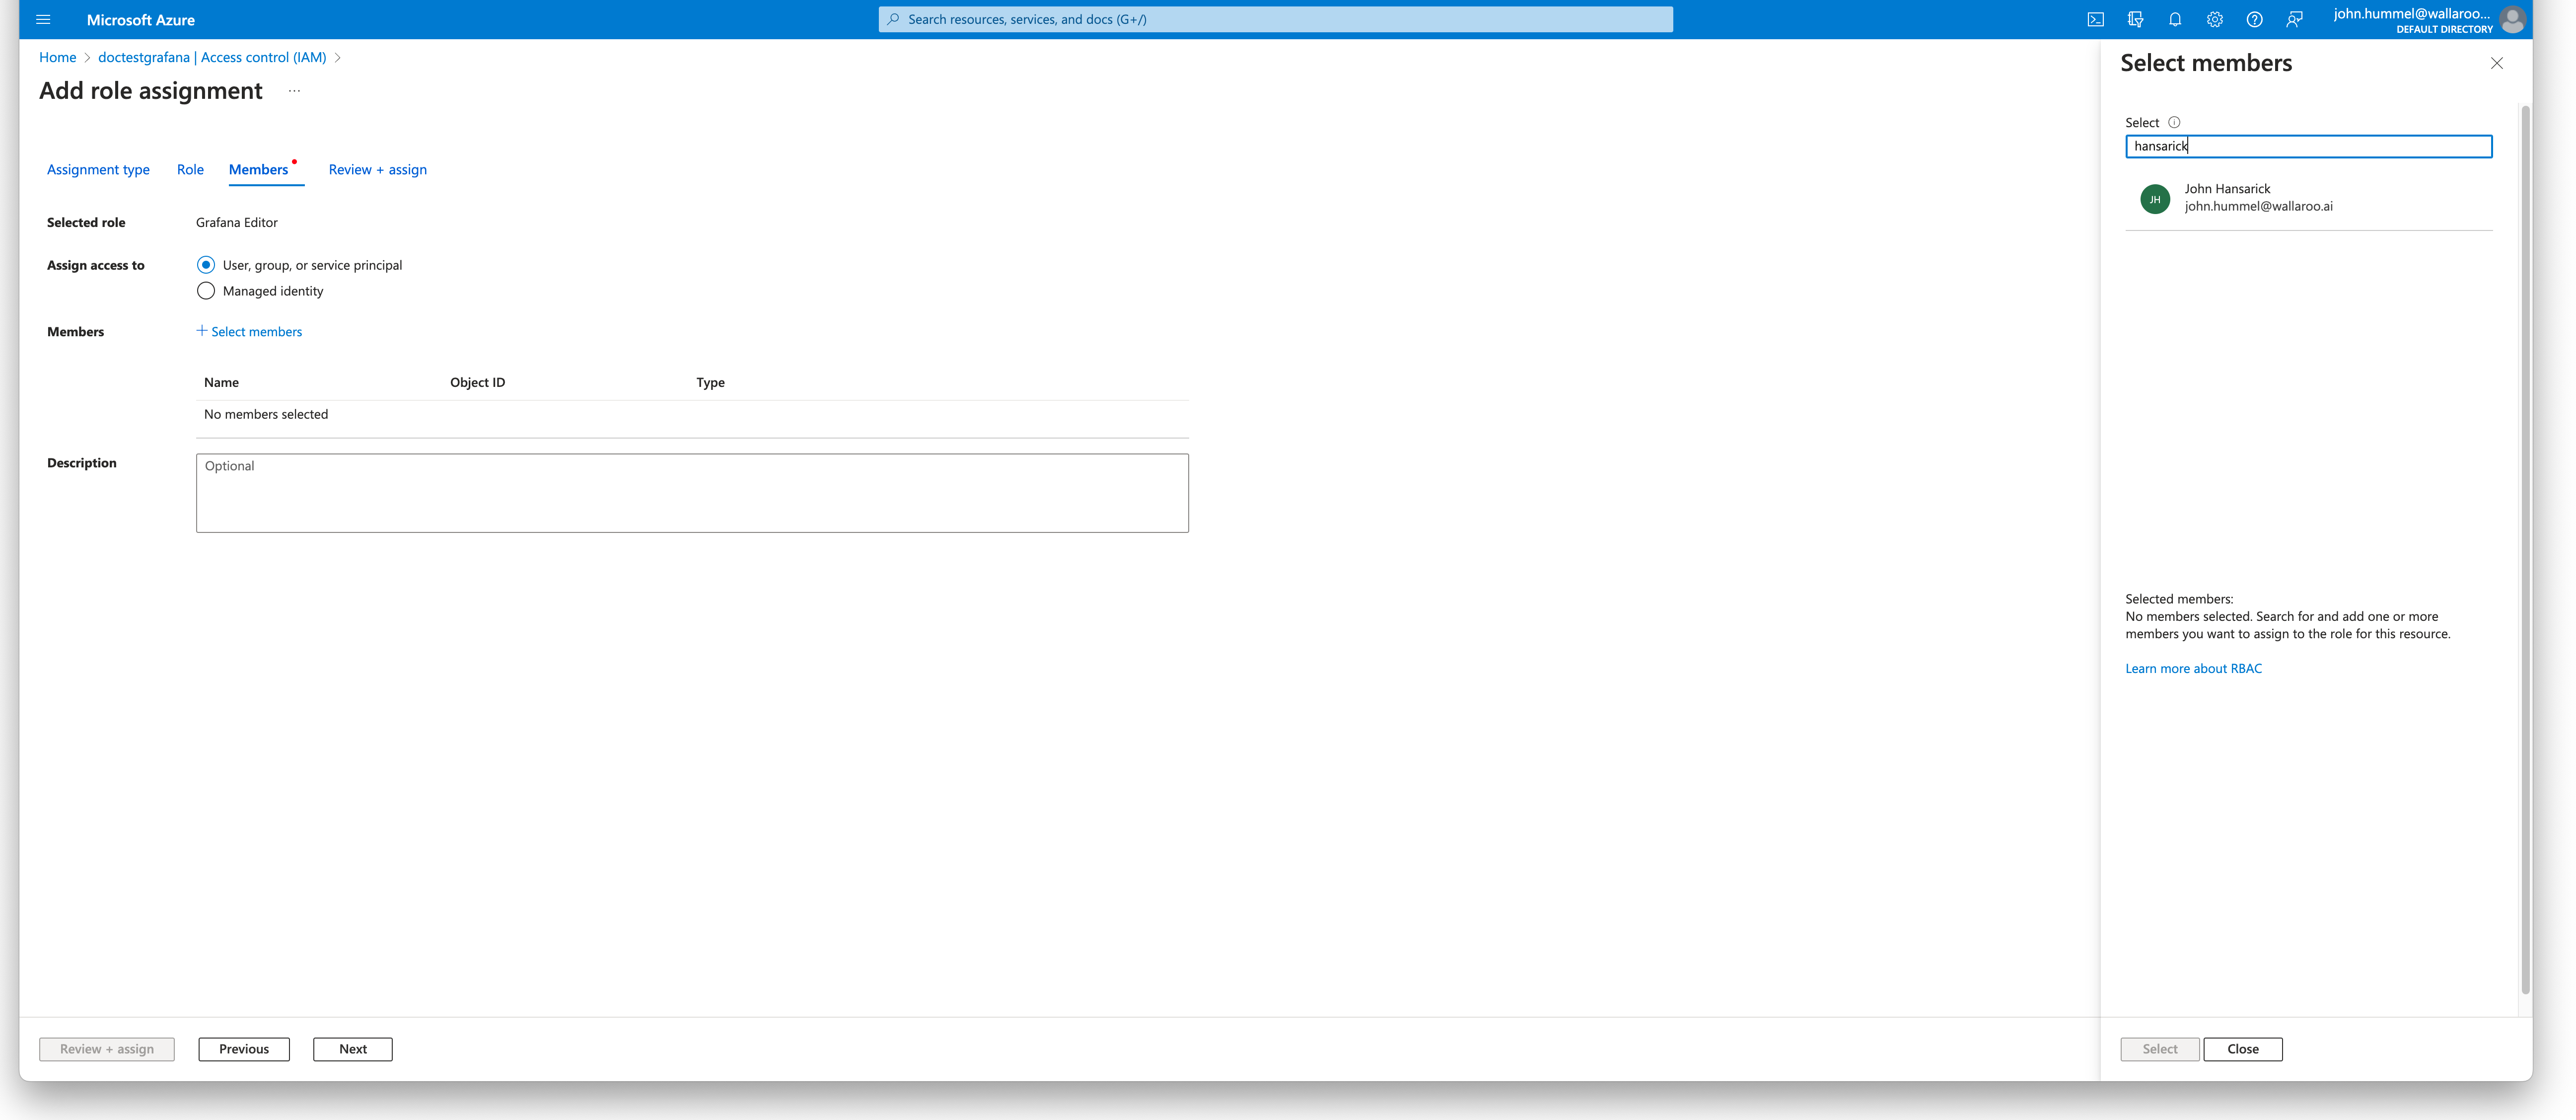
To add a new user or group access, select + Add->Add role assignment.
Select Job function roles, then select Next.
Select the role, then select Next.
Under Members, select +Select members and select from the user or group to assign to the Grafana role. Select Review + assign. Review the settings, then select Review + assign to save the settings.
2 - Monitor Wallaroo Pipeline Logs through Kubernetes
How to retrieve pipeline inference logs through Kubernetes.
Wallaroo provides interactive error messages and pipeline inference logs available through the Wallaroo SDK and Wallaroo MLOps API.
The following provides additional methods for tracing logs through the Kubernetes (K8s) logs interface. The instructions below focus on using the kubectl command line interface. Other Kubernetes monitoring tools, such as Lens are also useful for monitoring Kubernetes based logs through a friendlier user interface.
These instructions are valid for nearly any Kubernetes deployment in cloud or stand-alone environments. Check with the specific provider for additional details.
Note that Kubernetes logs are short term and are not persistent; once a Wallaroo pipeline is undeployed or the Kubernetes cluster is halted, these logs are no longer available. This troubleshooting process is best in gathering logs from Kubernetes to debug the ML models within the Wallaroo inference engine while it is deployed.
Prerequisites
Kubectl access.
Kubernetes kubectl Steps
Retrieve the pipeline name. Remember this name.
Use
kubectl get nsto list
namespaces.Choose the namespace best matching the pipeline name (there are some extra digits
on the end indicating the version number).In that namespace will be the following Kubernetes pods, where
xxxis the unique identifier for the pod:engine-xxx: This is the Wallaroo Inference Engine for Native Runtimes (onnx,tensorflow, etc). See the complete list of Models and Runtimes for full details.engine-sidekick-PIPELINE-xxx: This is the Wallaroo Inference Engine for Containerized Runtimes (hugging-face,BYOP, etc). See the complete list of Models and Runtimes for full details.engine-lb-xxx- this is the engine load balancer and is not used for retrieving inference logs.
For Native Runtime deployments, list the Inference Engine logs with the following command:
kubectl logs -n NAMESPACE engine-xxxxxxFor Containerized Runtime deployments, list the Inference Engine logs with the following command:
kubectl -n NAMESPACE engine-sidekick-xxxxx
Kubernetes Log Example
The following is an example transcript of retrieving logs for a ML Model of framework wallaroo.framework.Framework.PYTHON.
kubectl get namespaces
| NAME | STATUS | AGE |
|---|---|---|
| forecast-14 | Active | 86m |
| default | Active | 21d |
| kube-flannel | Active | 21d |
| kube-node-lease | Active | 21d |
| kube-public | Active | 21d |
| kube-system | Active | 21d |
| wallaroo | Active | 21d |
pov.wallaroo.io ~ kubectl get pods -n forecast-14
| NAME | READY | STATUS | AGE |
|---|---|---|---|
| engine-f4b858d65-k7fnr | 1/1 | RUNNING | 87m |
| engine-lb-74b4969486-fhdpd | 1/1 | RUNNING | 87m |
| engine-sidekick-forecast-14-6999d7644f-2tb6g | 1/1 | RUNNING | 87m |
forecast-14 engine-f4b858d65-k7fnr | less

2024-01-01T19:15:06.249058Z  INFO fitzroy::model::manager: Loaded model SHA 3ed5cd199e0e6e419bd3d474cf74f2e378aacbf586e40f24d1f8c89c2c476a08
2024-01-01T19:15:06.249083Z  INFO fitzroy::model::manager: Adding model with SHA 3ed5cd199e0e6e419bd3d474cf74f2e378aacbf586e40f24d1f8c89c2c476a08
2024-01-01T19:15:06.413770Z DEBUG hyper::proto::h1::io: parsed 4 headers
2024-01-01T19:15:06.413796Z DEBUG hyper::proto::h1::conn: incoming body is empty
2024-01-01T19:15:06.413891Z DEBUG hyper::proto::h1::io: flushed 117 bytes
2024-01-01T19:15:06.750506Z  INFO fitzroy::model::manager: Loaded model SHA 3ed5cd199e0e6e419bd3d474cf74f2e378aacbf586e40f24d1f8c89c2c476a08
2024-01-01T19:15:06.750531Z  INFO fitzroy::model::manager: Adding model with SHA 3ed5cd199e0e6e419bd3d474cf74f2e378aacbf586e40f24d1f8c89c2c476a08
2024-01-01T19:15:07.251029Z  INFO fitzroy::model::manager: Loaded model SHA 3ed5cd199e0e6e419bd3d474cf74f2e378aacbf586e40f24d1f8c89c2c476a08
2024-01-01T19:15:07.251087Z  INFO fitzroy::model::manager: Adding model with SHA 3ed5cd199e0e6e419bd3d474cf74f2e378aacbf586e40f24d1f8c89c2c476a08
...(additional entries follow)
Using less
less is a Linux util for paging through large amounts of text. Putting it at the end of a command, such as “kubectl logs” will let you page through the logs. When viewing the log data you can navigate through with a variety of single-character commands. The most important are:
| Key | Function |
|---|---|
| q | Quit |
| G | Go to the end of the file / log |
| g | Go to the top of the log |
| Page up / down | Page through the file |
| ? | Search backwards through the file |
| / | Search forwards through the file |