LLM Inference Autoscaling Benchmarks
Table of Contents
The following benchmarks were created with a Llama 3 8b LLM deployed in Wallaroo with different autoscale triggers by queue depth.
Configuration
Llama 3 8b vLLM used the following configuration:
- Resources per Replica:
- CPUs: 4
- Memory: 15 G
- GPUs: 1 NVIDIA A100 40GB
- Autoscale Triggers: These triggers apply based on the queue depth of inference submissions. See Autoscaling for LLMs for full details.
- Scale up Queue Depth: 5. The threshold for autoscaling additional replicas are scaled up over the Autoscale Window. In this instance, if the queue depth remains at 5 for 60 minutes or longer, additional replicas are engaged.
- Scale Down Queue Depth: 1. The threshold for autoscaling down replicas over the Autoscale Window. In this instance, if the queue depth remains at 1 for 60 minutes or longer, then the replicas are scaled down.
- Autoscale Window: 60. This represents an autoscale window of 60 seconds.
- Replica Autoscale Max/Min: (2,0). The deployment will start at 0 replica, then deploy one replica when the first inference request is received until the maximum of 2 is reached based on queue depth. Replicas are spun up or down according to the autoscale trigger values.
This deployment configuration is set through the Wallaroo SDK. See Deployment Configuration with the Wallaroo SDK for more details.
deployment_config = DeploymentConfigBuilder() \
	.cpus(1).memory('2Gi') \
	.sidekick_cpus(model, 4) \
	.sidekick_memory(model, '15Gi') \
	.sidekick_gpus(model, 1) \
	.deployment_label("wallaroo.ai/accelerator:a100") \
	.replica_autoscale_min_max(2,0) \
	.scale_up_queue_depth(5) \
	.scale_down_queue_depth(1) \
	.autoscaling_window(60) \
	.build()
Model Attributes
The Llama 3 8B LLM has the following attributes.
max_tokens=4096temperature=0.5top_p=0.9
For the input, the same input was used each time: “Describe what Wallaroo.AI is.” This input is roughly 7 tokens.
Summary
For this scenario, we used three different load profiles with the following attributes:
- Duration: How long the inference requests were submitted under the specific load.
- Number of Requests per Interval: For each of the profiles, a different interval per inference request was used:
- 1 request ever 15 seconds.
- 1 request every 6 seconds.
- 1 request every 30 seconds
In each load profile the average model throughput was **63 to 66 tokens per second (toks/s).
| Duration | Request Interval | Tokens Per Second (toks/s) |
|---|---|---|
| 40 minutes | 15 seconds | 63-66 toks/s |
| 30 minutes | 6 seconds | 63-66 toks/s |
| 20 minutes | 30 seconds | 63-66 toks/s |
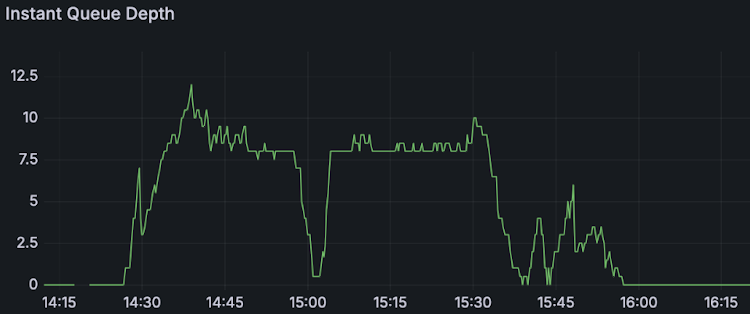
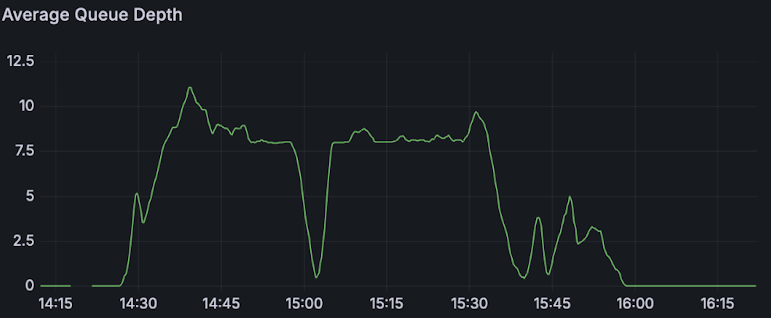
The following charts show the results of each profile showing:
| Measurement | Chart |
|---|---|
| Instant queue depth |  |
| Average queue depth |  |
| Queries per Second (3 minute average) |  |
| Replicas Deployed |  |
Detailed Load Testing Results
For these tests, rather then sending single prompts via multiple clients at once, a specific number of queries (aka prompts) are submitted per second as Queries per Second (qps) to represent a real world scenario.
Each load test set a different load profile with the same deployment configuration, automatic triggers by queue and query. These load profiles are defined by the following.
- Duration
- Request Interval
This benchmark summary has the following load profile:
- Duration: 40 minutes
- Request Interval: 1 request every 15 seconds
Summary:
  Success rate: 99.33%
  Toks/s:     63-66 Toks/s
  Total:    	2665.0327 secs
  Slowest:  	300.4556 secs
  Fastest:  	0.3539 secs
  Average:  	186.7747 secs
  Requests/sec: 0.0559

  Total data:   665.91 KiB
  Size/request: 4.50 KiB
  Size/sec: 	255 B

Response time histogram:
	0.354 [1]  |
   30.364 [38] |■■■■■■■■■■■■■■■■■■■■
   60.374 [0]  |
   90.384 [3]  |■
  120.395 [5]  |■■
  150.405 [4]  |■■
  180.415 [4]  |■■
  210.425 [6]  |■■■
  240.435 [12] |■■■■■■
  270.445 [15] |■■■■■■■■
  300.456 [60] |■■■■■■■■■■■■■■■■■■■■■■■■■■■■■■■■

Response time distribution:
  10.00% in 0.3716 secs
  25.00% in 13.4007 secs
  50.00% in 242.8536 secs
  75.00% in 300.3529 secs
  90.00% in 300.3748 secs
  95.00% in 300.4139 secs
  99.00% in 300.4468 secs
  99.90% in 300.4556 secs
  99.99% in 300.4556 secs
This benchmark summary has the following load profile:
- Duration: 30 minutes
- Request Interval: 1 request every 6 seconds
Summary:
  Success rate: 100.00%
  Toks/s:     63-66 Toks/s
  Total:    	2097.6813 secs
  Slowest:  	300.6042 secs
  Fastest:  	5.9411 secs
  Average:  	240.3449 secs
  Requests/sec: 0.0591

  Total data:   783.87 KiB
  Size/request: 6.32 KiB
  Size/sec: 	382 B

Response time histogram:
	5.941 [1]  |
   35.407 [3]  |■
   64.874 [1]  |
   94.340 [2]  |■
  123.806 [3]  |■
  153.273 [1]  |
  182.739 [9]  |■■■■■
  212.205 [16] |■■■■■■■■■
  241.672 [12] |■■■■■■
  271.138 [21] |■■■■■■■■■■■■
  300.604 [55] |■■■■■■■■■■■■■■■■■■■■■■■■■■■■■■■■

Response time distribution:
  10.00% in 157.6964 secs
  25.00% in 202.1763 secs
  50.00% in 253.7781 secs
  75.00% in 300.3565 secs
  90.00% in 300.4004 secs
  95.00% in 300.4220 secs
  99.00% in 300.5641 secs
  99.90% in 300.6042 secs
  99.99% in 300.6042 secs
This benchmark summary has the following load profile:
- Duration: 20 minutes
- Request Interval: 1 request every 30 seconds
Summary:
  Success rate: 100.00%
  Toks/s:     63-66 Toks/s
  Total:    	1204.9610 secs
  Slowest:  	250.5012 secs
  Fastest:  	3.6233 secs
  Average:  	95.1243 secs
  Requests/sec: 0.0332

  Total data:   356.77 KiB
  Size/request: 8.92 KiB
  Size/sec: 	303 B

Response time histogram:
	3.623 [1] |■■■■
   28.311 [8] |■■■■■■■■■■■■■■■■■■■■■■■■■■■■■■■■
   52.999 [3] |■■■■■■■■■■■■
   77.687 [6] |■■■■■■■■■■■■■■■■■■■■■■■■
  102.374 [4] |■■■■■■■■■■■■■■■■
  127.062 [3] |■■■■■■■■■■■■
  151.750 [6] |■■■■■■■■■■■■■■■■■■■■■■■■
  176.438 [5] |■■■■■■■■■■■■■■■■■■■■
  201.126 [1] |■■■■
  225.813 [2] |■■■■■■■■
  250.501 [1] |■■■■

Response time distribution:
  10.00% in 15.0363 secs
  25.00% in 46.1130 secs
  50.00% in 94.4357 secs
  75.00% in 143.8420 secs
  90.00% in 185.1688 secs
  95.00% in 213.0770 secs
  99.00% in 250.5012 secs
  99.90% in 250.5012 secs
  99.99% in 250.5012 secs